EOM We All Know the History

Weekly Continuous

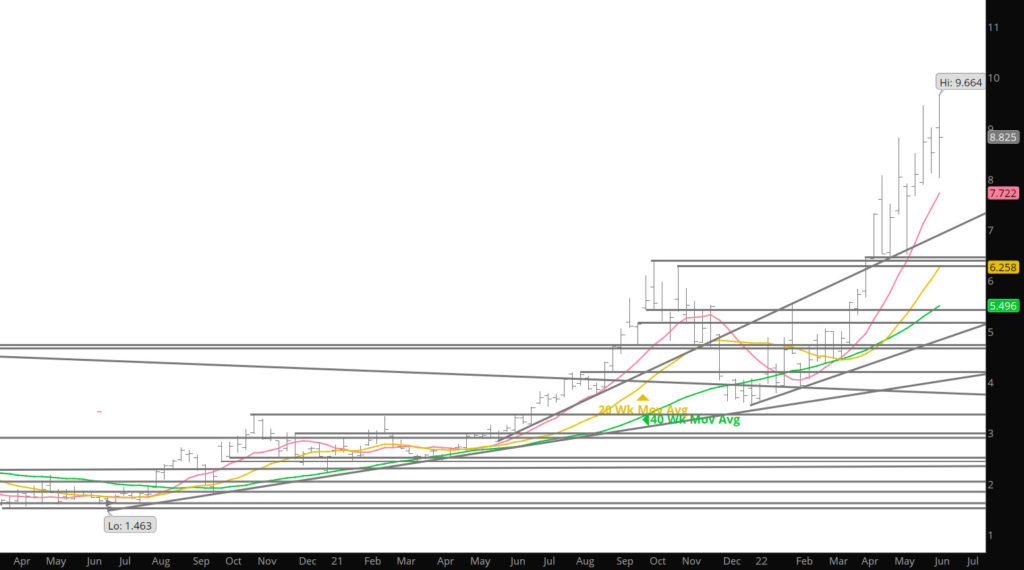
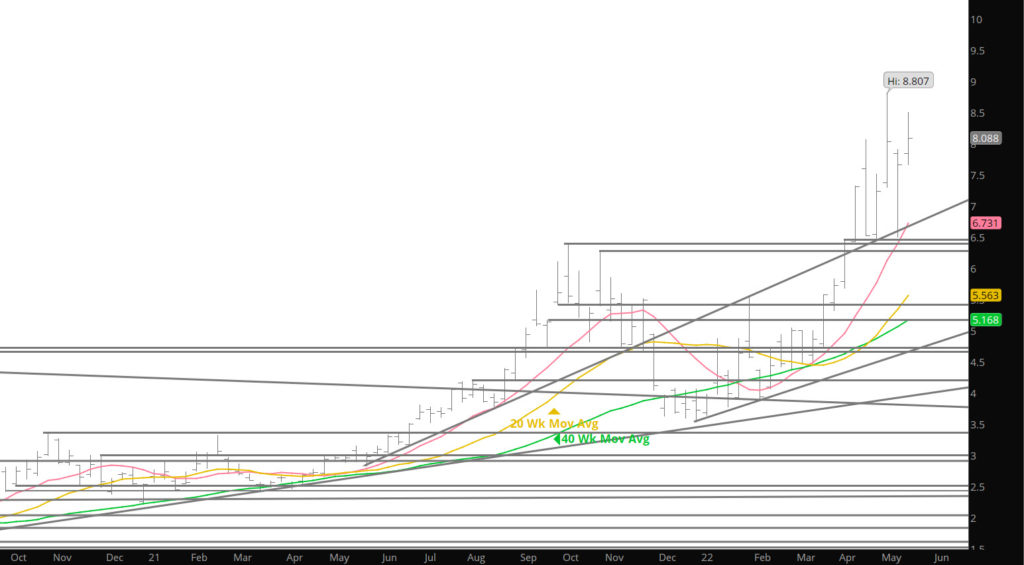
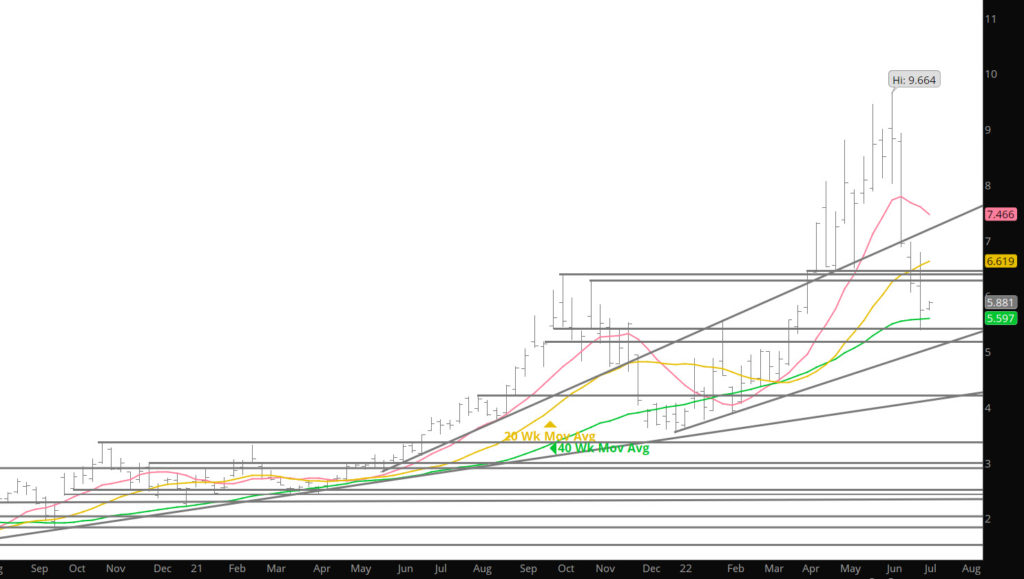
June closed with a new contract high weekly close at $8.083 it was also a new high weekly close on continuation basis and was above the April high. While the soon to expire prompt posted a weekly gain ($.420) being the third higher weekly close of the four Fridays during its tenure, the week experienced three straight lower daily closes on (Wednesday, Thursday, and Friday for the first time since early March.

While volatility remains extreme, this week the 15 – week ATR (average true range) calculation was $.986 (down from $1.107 on May 6 which was the highest since November ’06 (see Weekly chart below). Regardless of the volatility, June has made little sustainable upside progress over the last month. June closed at $7.958 on April 18th, at $8.043 on May 6th, $7.956 on 05/16 and Friday at $8.083.

To read The Daily Call you must be a subscriber (Current members sign in here. ) Start your subscription today.

Divergence Developing and History

Weekly Continuation
Spot June Contract

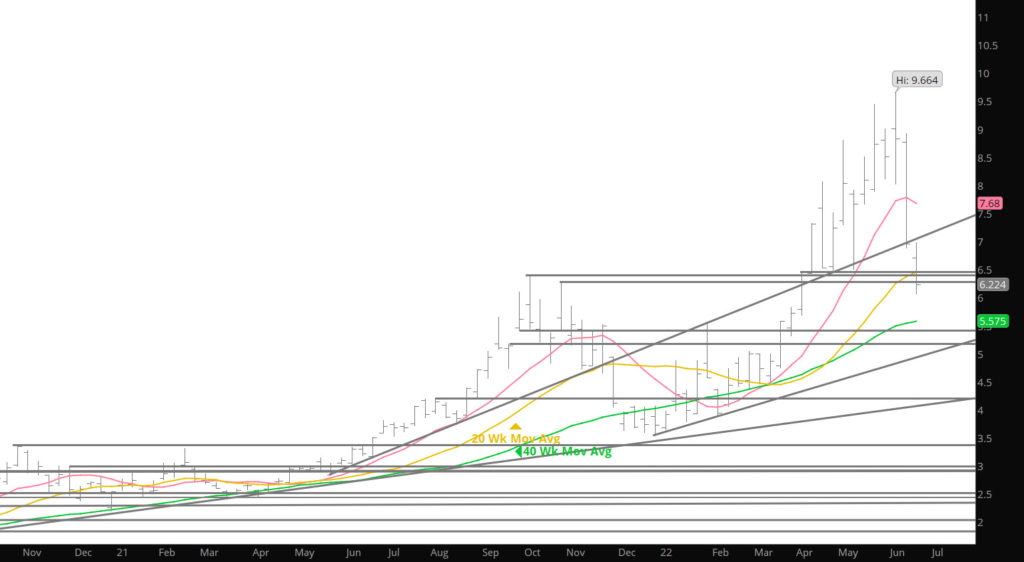
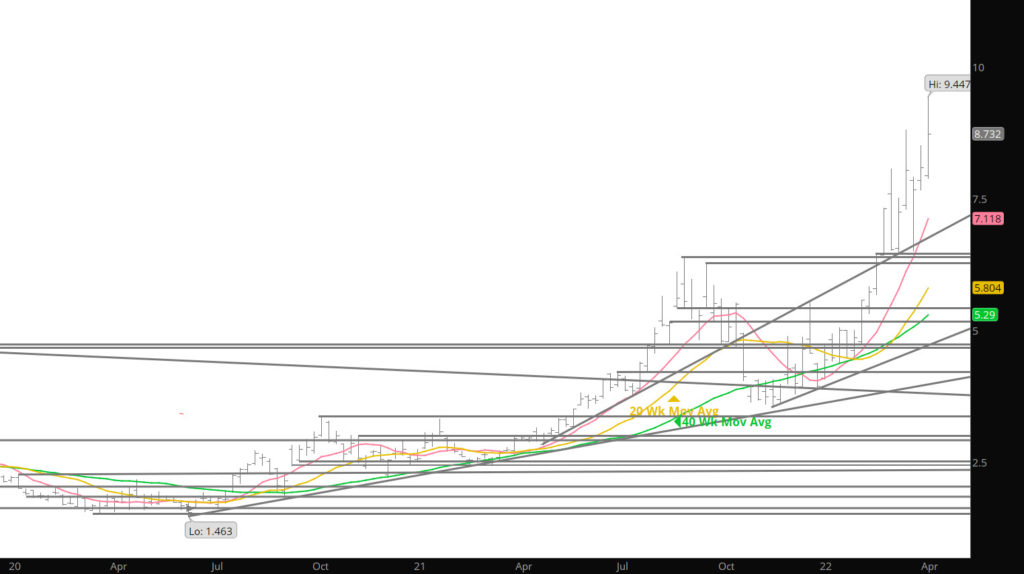
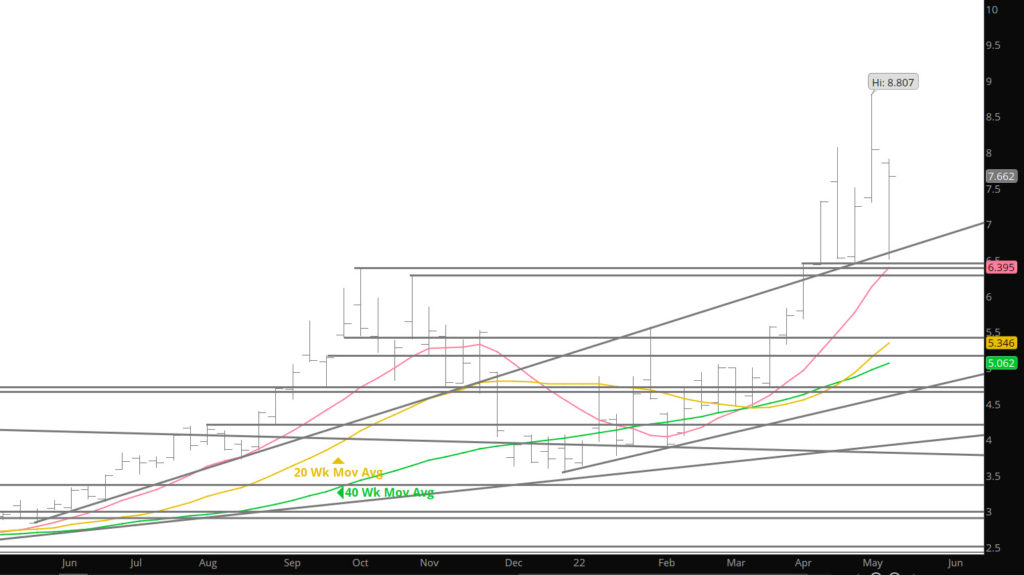
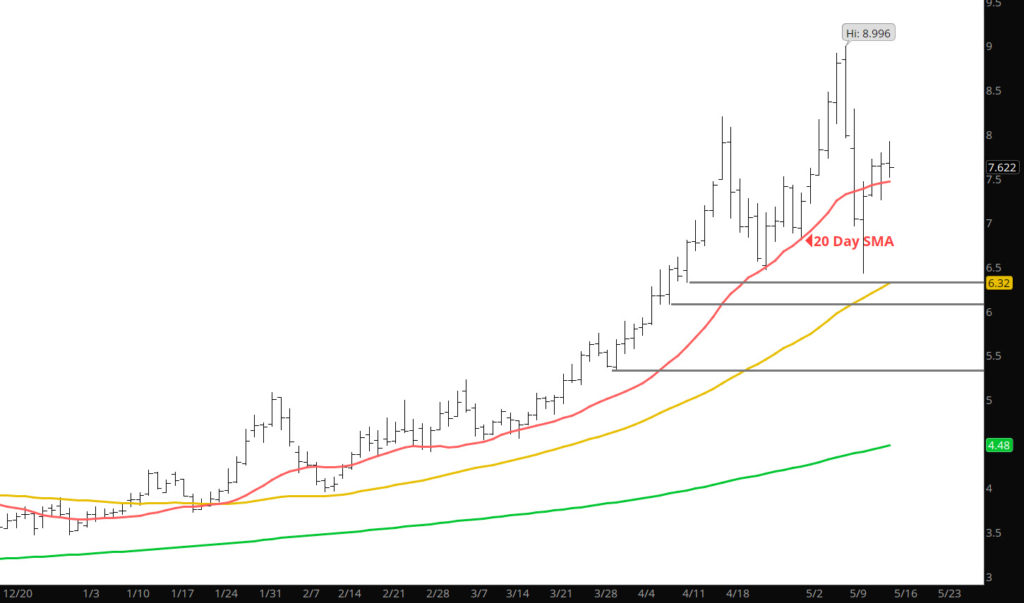
From the previous week’s reversal, prices gaped lower at the open last week (though quickly filled) continued a decline that extended down to the lows $2.566 below previous last Friday’s reversal high, and testing support presented by the April low ($6.345 last higher low), and into a zone between the September and October ’21 highs ($6.280 – $6.466. From the December low ($3.536) to the May 6th high ($8.996) prompt gas has rallied $5.43 or 153.6%. The second largest in terms of price increase; the largest in terms of percentage increase in the history of natural gas trading (more history below).

Market internals continued to show divergence two weeks ago. This last week volume accelerated as the market fell (Monday and Tues), then declined as it recovered. Open interest declined for five straight days while price fell (from Thursday to Thursday losing nearly 31,000 contracts), bringing the total decline to more than 80,000 since mid – April. Lower level of open interest can create more volatility (less positions to be defended). A more significant technical issue is that neither volume nor open interest has confirmed the April OR May highs. Higher price highs without higher volume or open interest is a significant price negative divergence. The weekly RSI has formed the classic divergence as the higher Weekly high during the week of May 2nd (Friday the 6th) did not confirm with a higher high level.

To read The Daily Call you must be a subscriber (Current members sign in here. ) Start your subscription today.

Prices Reverse Off of A 13 Year High Trade
Weekly Continuous

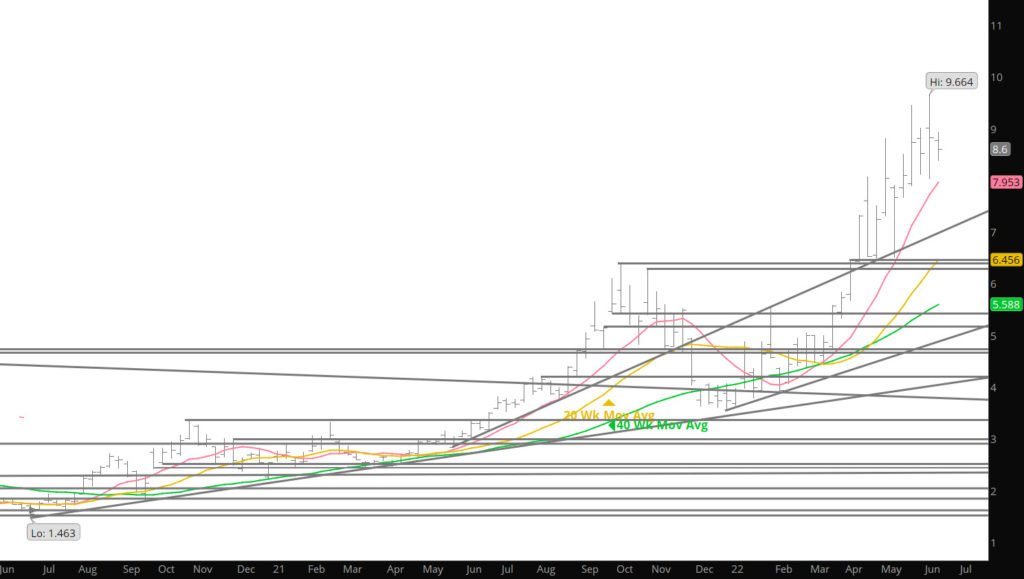
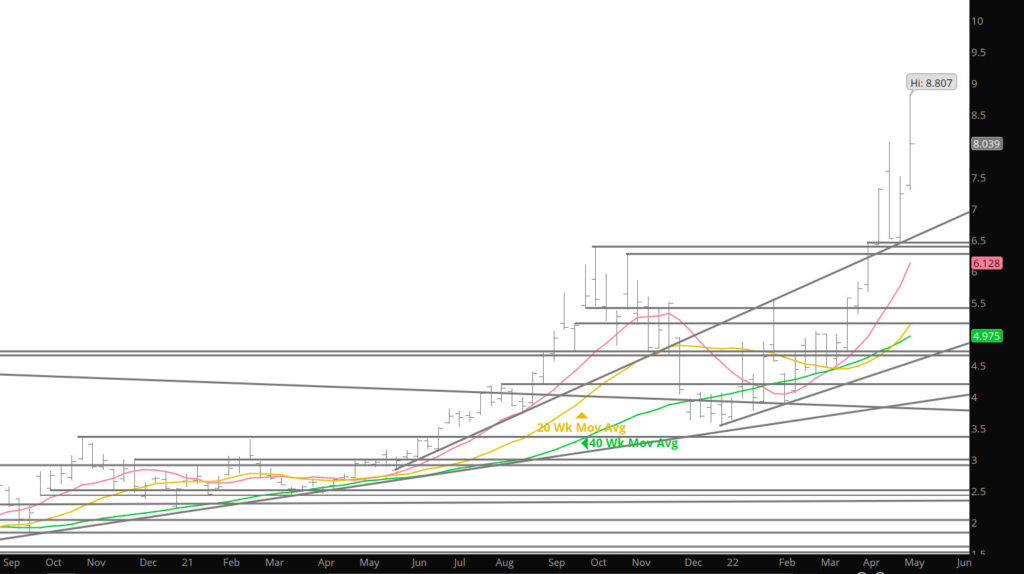
Prompt May extended the rally from the previous meager test of its 20 – day SMA for six straight trading days, rising $2.191, before reversing. On Friday May fell more than a dollar from the highest price traded in 13+ years and ended the week back below the April high (perhaps significant). Despite the decline during Friday’s outside day reversal, prompt gas still finished the week $.799 higher.

The gas market is extremely overbought by most all of my metrics. The weekly MACD the primary lagging indicator (used sparingly here but monitored on an every week basis for the last thirty years) has exceeded its extreme reading coincident with last year’s high. Simultaneously, the weekly RSI, the primary leading indicator, is yet to confirm the April high (RSI should confirm the weekly high with a higher close).

Prompt gas is extended more than 50% above the intermediate long – term trend defining 40 – week SMA. Since (and including ’00) this is the ninth time prompt gas has been extended this far. Currently, separation from the rising moving average measures 60.8%. Last fall weekly closing prices remained more than 50% above the moving average for seven weeks and at the peak the separation was 67.5% before the decline toward the December low began. The one factor that each of the prior occurrences has in common is that once the regression begins the decline to the mean is rapid. Ten weeks after last fall’s peak extension prompt gas closed below the 40 – week SMA.

Prompt gas traded to three standard deviations above the twenty – week SMA for the third time in four weeks. Last fall there was a nearly identical sequence before prompt gas returned to the 20 – week SMA. Markets in definable trends typically respect shorter term moving averages. Without exception, every expiring contract for more than a year has settled above its 20 – day SMA. More often than not that relatively short–term moving average has been tested and held during the middle of the prompt and presenting a low risk buying point. Expect June to test its 20 – day during its tenure, before a rally into expiration.

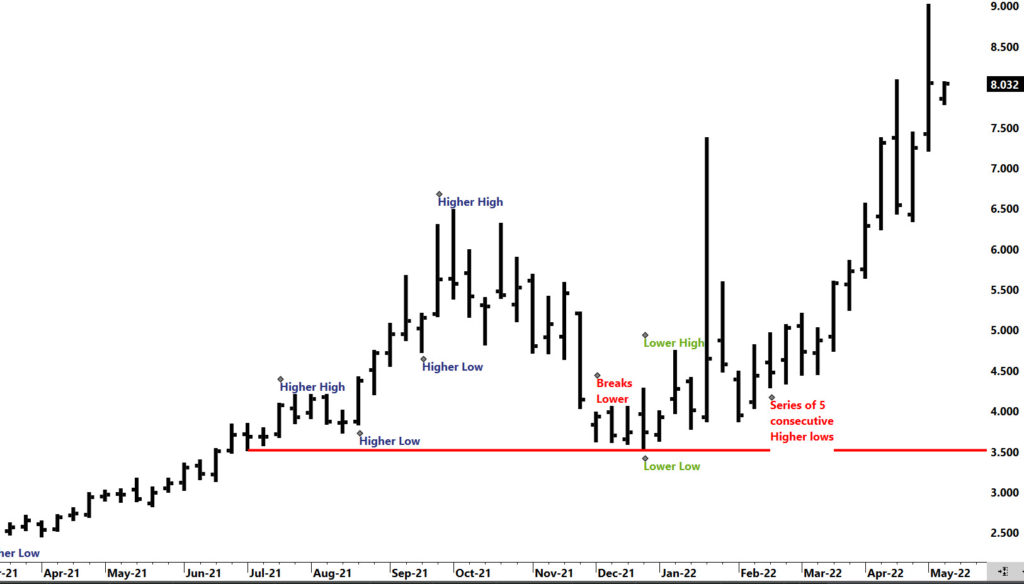
Whether the short–term moving average continue to provide supports they did for prompts April and May, the most important factor is the long series of higher highs and higher lows that define the uptrend (discussed here for over two years) see chart below. Despite a weekly reversal from the April high and a decline from high to low of more than $1.70, prompt gas came nowhere near breaking that pattern. Violation of that April low ($6.345) would suggest a change in character for the gas market. Continue to expect prompt gas and the strips to find support above prior significant lows.
Weekly Continuous — Higher Highs and High Lows

Major Support:, $7.00-$6.855, $6.411-$6.392, $6.247-$6.278, $5.27-$5.199, $5.001, $4.40-$4.26, $4.187
Minor Support: $6.00, $5.063, $5.04, $4.88, $4.60-$4.557
Major Resistance:
$8.47-$9.60

Trend Continues With Strong Expiration – Weakness For a Day

Weekly Continuation

As expected, prices rallied into the expiration process, setting the week’s high only to give a chunk of the gains up as June took over as prompt. Was interesting for this observer to watch the Friday trade on a 5 minute chart as prices leaped up from $7.05 to $7.30 in a matter of 10 minutes . That action smells to this trader as the machines and the algorithms rocking the market (the same type of event happened last month during the $1.60 correction off of the highs). This type of activity can create serious risk issues for those of us the don’t have the machine based algorithms nor the quickness to respond to bid/offer spreads with volume. Not complaining, just wanting to make you better at understanding the potential risks in your trading.

Prompt June but again found support at the rising trend line and 20 – day SMA with value of the trend line being $6.785, the 20 – day SMA of June gas was 6.796…the low trade 6.805. Successive months have now held their 20 – day SMAs as the most recent series of higher lows has traded and provided low risk entry points.

To read The Daily Call you must be a subscriber (Current members sign in here. ) Start your subscription today.

Expected Correction Occurs

Weekly Continuation

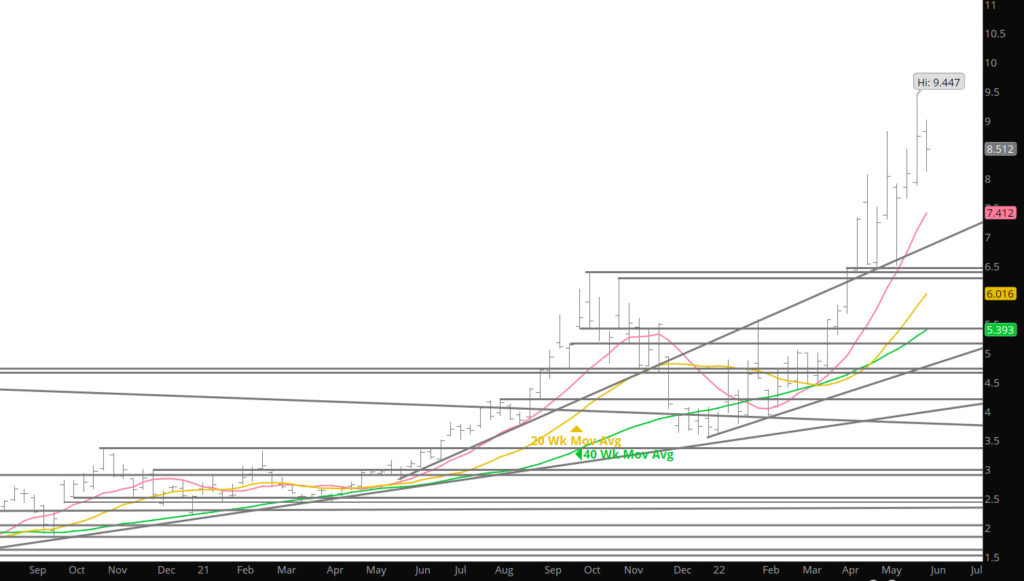
Mentioned in the Daily last week that due to the “blow-off” formation that the gains from two weeks ago would be lost during the correction from the over bought condition. Prices did not quite make the week a technical “outside week reversal” but came close as they set a higher weekly high but not close below the previous week low at $6.247. While the collapse did not facilitate the defined technical term, the reversal after setting the high, was significant and invokes technical damage short term. This sets up an interesting battle– as discussed here for numerous months, price action during the month has been reasonably consistent over the last months as prices have weakened during the mid-month time period, only to find support and perform rallies into the expiration of the prompt contract. April has not provided that similar theme and has come into the expiration from a weakening bias. The trend for an extended period (nearly two years), has been for prices to rally into or during the expiration process (call it 5 days). There seems to be a struggle developing on the May expiration, as prices are weakening while the trend suggests the other direction. Not sure how the expiration plays out, but can express that the summer (Q2) rally has not achieved its goal regardless of the reversal.

The primary reason for that assessment is the open interest trail in the market internals– until a larger increase in participation (open interest positions) is in evidence the gas market is unlikely to trade a final high (September ’21 total open interest reached a high of 1,468,636 and final price high traded three weeks later. Open interest is currently 1,143,359 contracts- preliminary data from the CME, nearly the same as mid – December). As suggested a couple of weeks ago — this may be the end of a series of runs that may continue until June or July.

To read The Daily Call you must be a subscriber (Current members sign in here. ) Start your subscription today.

Blow Off Seems the Game

Weekly Continuous

Spoke last week that the rally looked to be more of a solid run not necessarily headed to a blow off topping formation. I will correct that assessment after last week’s Holiday shortened trade. Historically, dollar plus rallies (the current case 16.5% over four trading days), are characteristic of a speculative “blowoff” phase. Within that context, beyond the February expiration high there is little or no definable conventional resistance distinguishable on the continuation chart and there wasn’t the last week of January either.

An increase of 100,000 contracts during late March and early April brought total open interest back to approximately the same level that existed at or shortly following the rallies in Jan, Feb and Mar. Those rallies were all followed by corrections (Weekly Chart above) expect the same albeit from a dramatically higher price level.

To read The Daily Call you must be a subscriber (Current members sign in here. ) Start your subscription today.

Market Extends Gains — Momentum Indicators Entering Extreme Levels

Weekly Continuation

The week’s close at $6.278 was the highest since November ’08 . At that time prompt gas was declining from its July high of $13.694. Since 2008 May has settled higher than April in nine of fourteen years and three of the last four.

Volume and open interest increased along with price for the third straight week, during this period prompt gas has traded from $4.478 to $6.538. This week the average daily volume was an estimated 100,000 contracts higher than last week, which was 40,000 contracts higher than the week before. In the last three weeks, the total level of open interest increased more than 58,000 contracts. Volume and open interest moving in the same direction as price is a significant technical positive.

To read The Daily Call you must be a subscriber (Current members sign in here. ) Start your subscription today.

Bulls are Running

Weekly Continuation

For only the third time in the last thirteen years prompt gas traded through the February high during calendar March but as of yet the the prompt has not closed above that high. The other two years that met that condition were ’13 and ’17. In both of those years successive prompts built on gains before recording May – Q2 highs.

Volume and open interest increased along with price this week (a technical positive). Average daily volume was an estimated 60,000 contracts higher than last week’s lowest levels in nearly a year. Open interest increased a slight 4,000 contracts (from Thursday through Thursday, open interest statistics always lag by one day), leaving the total just above the early February low (the lowest total since the fall of ’16) and still below the level at the December price low.

To read The Daily Call you must be a subscriber (Current members sign in here. ) Start your subscription today.

Inside Week

Weekly Continuous

Following the tests of support on Monday and Tuesday April rallied to test the resistance beginning at $5 before fading into the weekly close. Despite reasonably serious challenges to both, neither the high nor the low of last week was violated. Accordingly, April traded an “inside” week, but with the close in the upper quadrant of this week’s range suggests that the resistance presented by multiple weekly highs will continue to be tested.

In addition to last week’s modest tightening of the range traded, the ongoing consolidation by prompt gas has been accompanied by a reduction in the average daily volume. Open interested increased, slightly, this week but remains below the December low. Volume, an estimated 1,250,000 contracts this week, was the lowest in nearly a year dating back to the week ending 04/02/21 (including weeks with only four trading days).

To read The Daily Call you must be a subscriber (Current members sign in here. ) Start your subscription today.

Price Action Showing Base Building

Weekly Continuation

For last week April lost $.291 and the summer strip lost $.247, while volume and open interest both declined. It is constructive technically when price, volume and open interest move in the same direction (see below).

Weekly Continuation with Volume and Open Interest

Total open interest declined another 12,562 contracts through 03/10 (open interest statistics lag one day) to just about exactly the same level as the week ending 02/11 which was the week that March gas traded its low before the big rally into expiration.

To read The Daily Call you must be a subscriber (Current members sign in here. ) Start your subscription today.