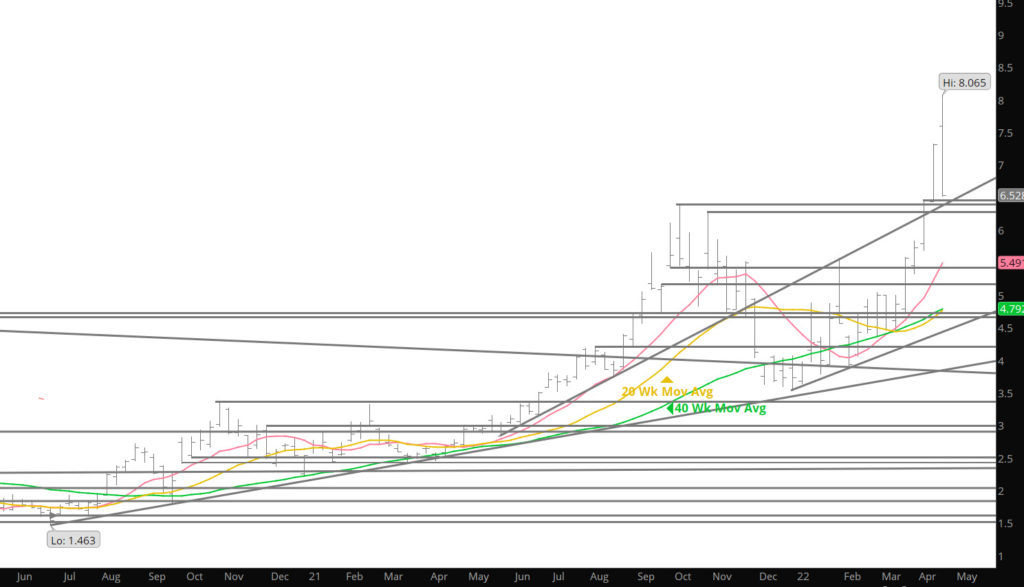
Secular Bull Market Continues

Weekly Continuation

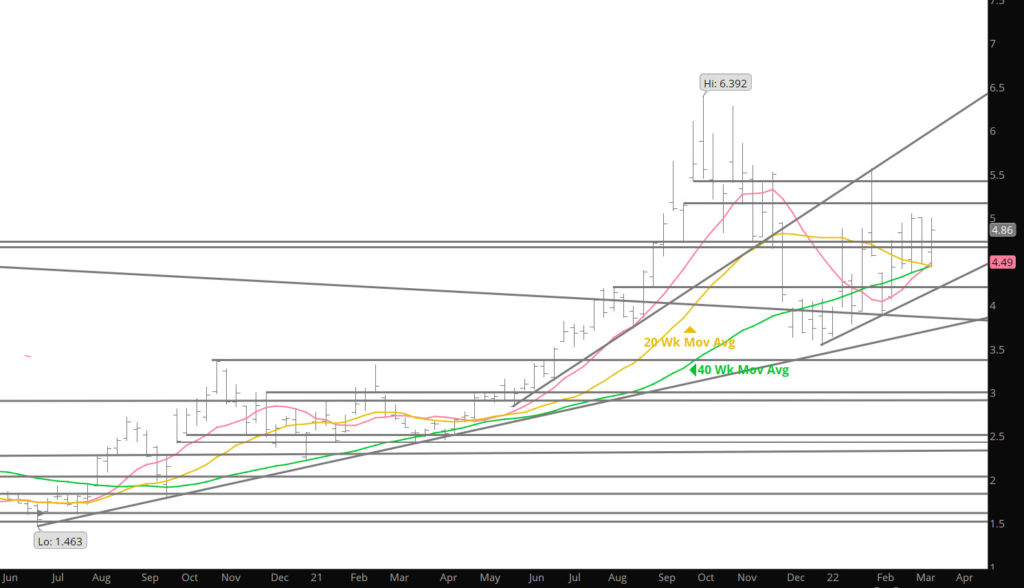
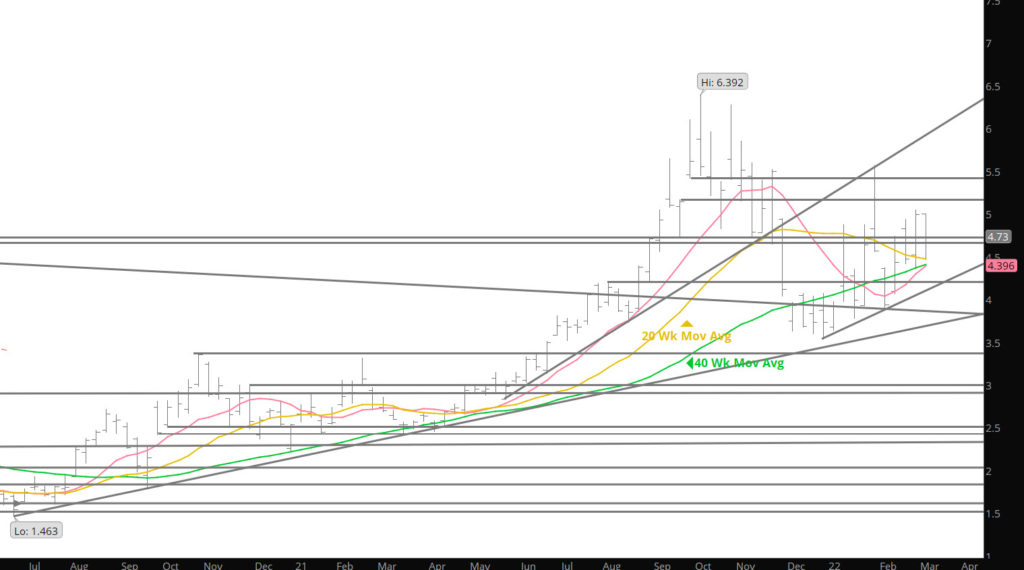
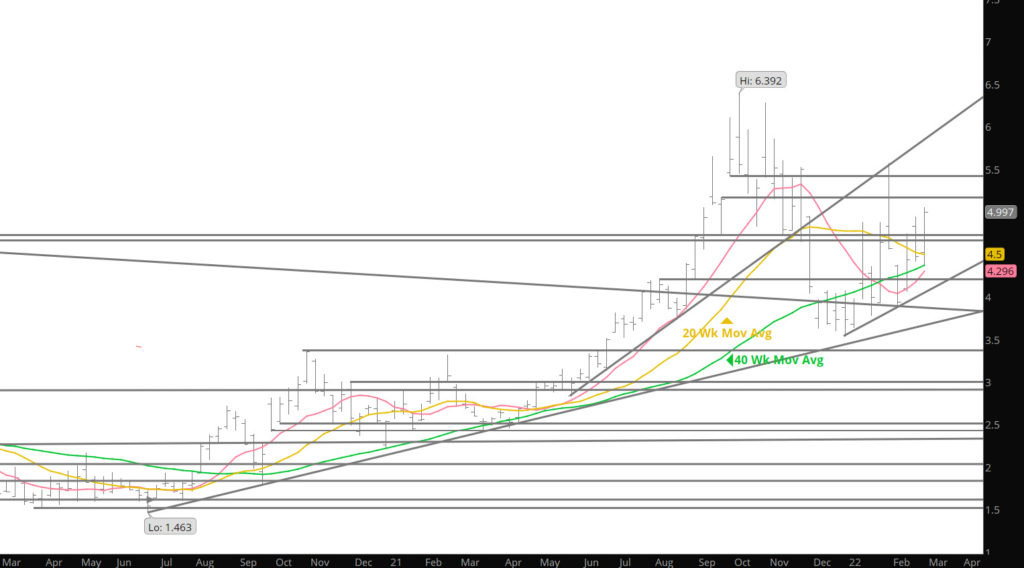
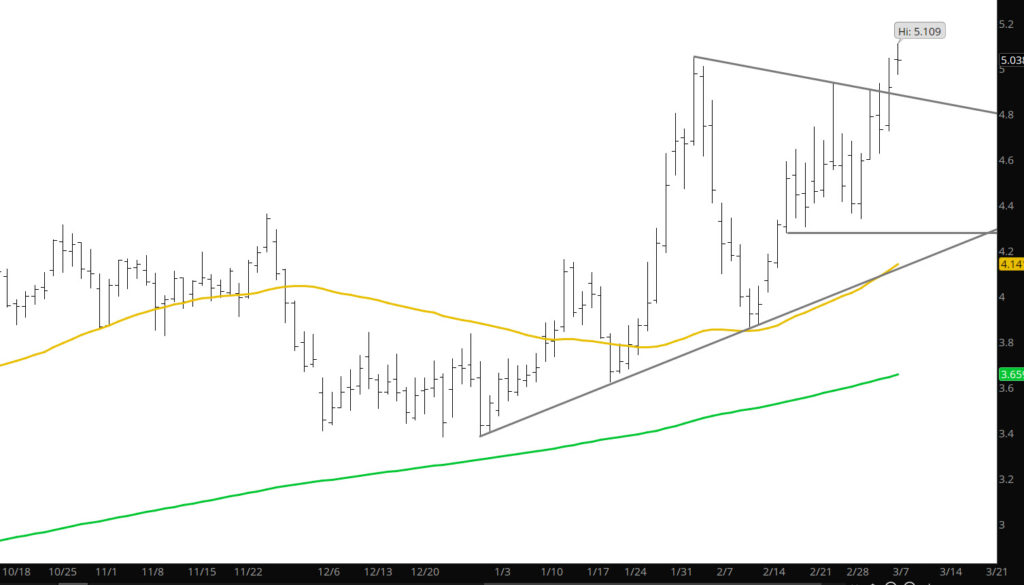
Remembering my high school Latin class (don’t ask me why) this word is used to define a long period of time which is the long period (nearly 2 years) that the gas market has been with a bullish bias. For the second time in two weeks prompt gas (the first being the last week of the March contract followed by the April), tested the intermediate – term defining 40 – week SMA at $4.42. A reversal from the support found on the April chart and the continuation moving average triggered a rally and a test of its February high (5.045 v 5.053, see chart below).

Spot April Contract

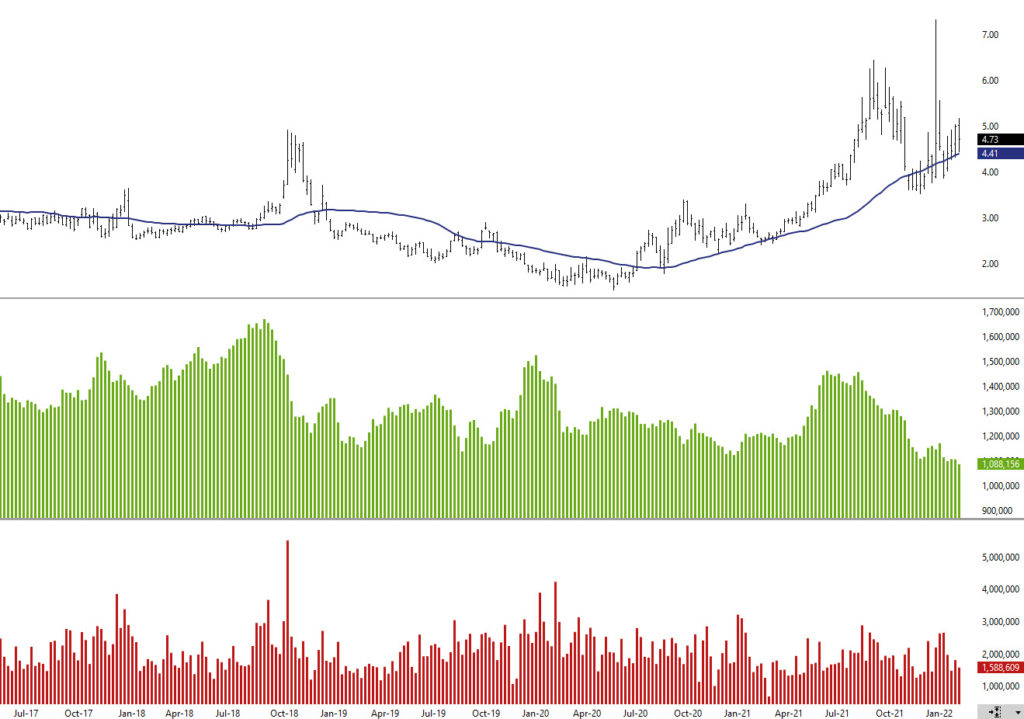
Total open interest, which declined by more than 94,000 contracts over seven trading sessions in early February to less than the total at the December 30th low (now considered the Q1 low for 2022), increased, but only modestly over the two weeks that followed. This last week the total number of contracts outstanding fell +/- 11,600 (though waiting for the final numbers from the CME) to 1,099,847, or about 10,000 contracts lower than at the end of December. The market volume was higher with total volume. Interesting to note that the total volume was higher but it was on a 4 day trade week, but average daily volume was just about unchanged with that of the last two weeks.

To read The Daily Call you must be a subscriber (Current members sign in here. ) Start your subscription today.

Does April Follow Recent Trends

Weekly Continuation

For the 12th consecutive month prices were well – bid through expiration, the majority of the time, during theses long run of price strength into the monthly expiration, the new prompt has been sold soon off after its predecessor has settled. Recall that March traded its contract high on 02/02 and then fell $1.696. February traded up to $4.077 on 12/28 and then fell to $3.536. January traded to $5.518 coincident with December expiration and then fell to $3.630 in six trading sessions. The last two of those when the calendar January and February traded lows, were higher lows. Granted, there are some international issues that may effect this recent trend but that may not break the trend but rather delay it.

The coming summer strip were largely unaffected by the expiration related volatility. At week’s end the summer was challenging resistance at previous weekly closing highs. It will be informative if the prompt April challenges it support levels in the coming week, providing the opportunity for the summer to weaken.

To read The Daily Call you must be a subscriber (Current members sign in here. ) Start your subscription today.

Expiration Find Strength

Weekly Continuation

As the last twelve months has proven — expiration’s have proven well bid into the expiration. This month seems to continue that trend if you look at the trade in the light President’s Day trade with prices rallying over $.35. This last week’s strong gains, moved the consensus of technical indicators (which is heavily weighted to the prompt contract) improved but remained neutral. This analysis is primarily because of the failure to close greater than the continuation 20 – week SMA. The last time prompt gas closed higher was week ending November 26th.

Given March’s rally from trend line support ( short – term trend line drawn from its December and January lows), with diminishing volume (the number of contracts traded each day during the past week was less than the corresponding day last week) and failure at the continuation 20 – week SMA suggests that addition long term gains may be limited. Until the market demonstrates that the late tenure sponsorship that has characterized the long string of expiring contract months has dissipated…or disappeared, it should be assumed that it will continue. When something has happened twelve of thirteen times, my bets are going to expect it to continue.

To read The Daily Call you must be a subscriber (Current members sign in here. ) Start your subscription today.

Redefine or Just Test Support Levels

Weekly Continuation

March gas gapped lower at the beginning of last week, then tried to close the gap and failed, creating a resistance target of $4.468 – $4.487 for the contract to challenge before or during expiration (likely in its final days as prompt). Traders should wait for March to redefine near term support during the coming week as last week’s prices suggests it either has done or is in the process of doing.

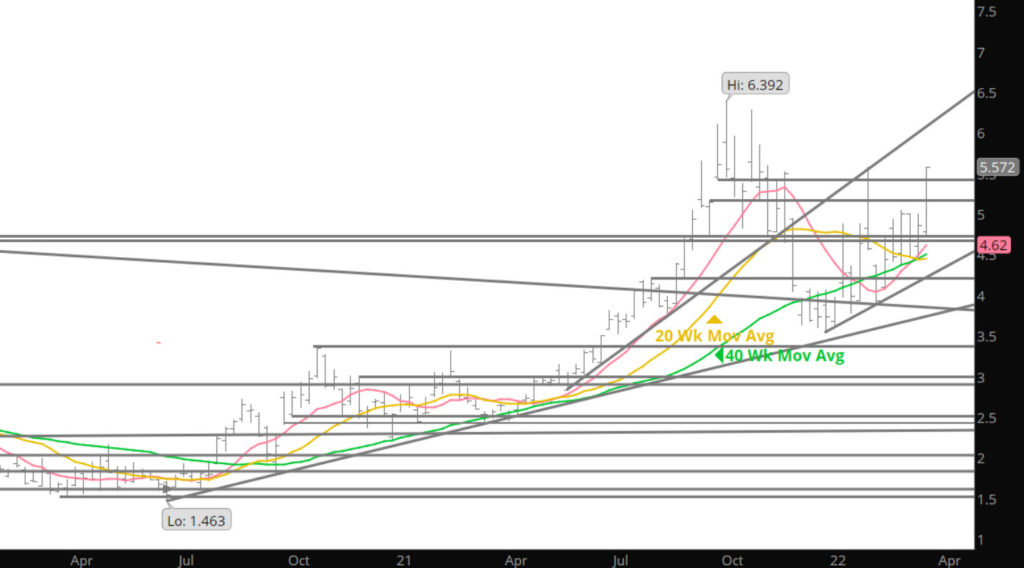
Since peaking at 1,182,657 open interest in total contracts outstanding (up from 1,104,958 at the beginning of the year) coincident with March trading to $5.572 (the biggest one – day spike in volume in nearly a year (02/16/21). That total open interest has now declined more than 94,000 contracts in seven trading days to less than the total at the December 30th low.

To read The Daily Call you must be a subscriber (Current members sign in here. ) Start your subscription today.

March Runs to A High

Weekly Continuation

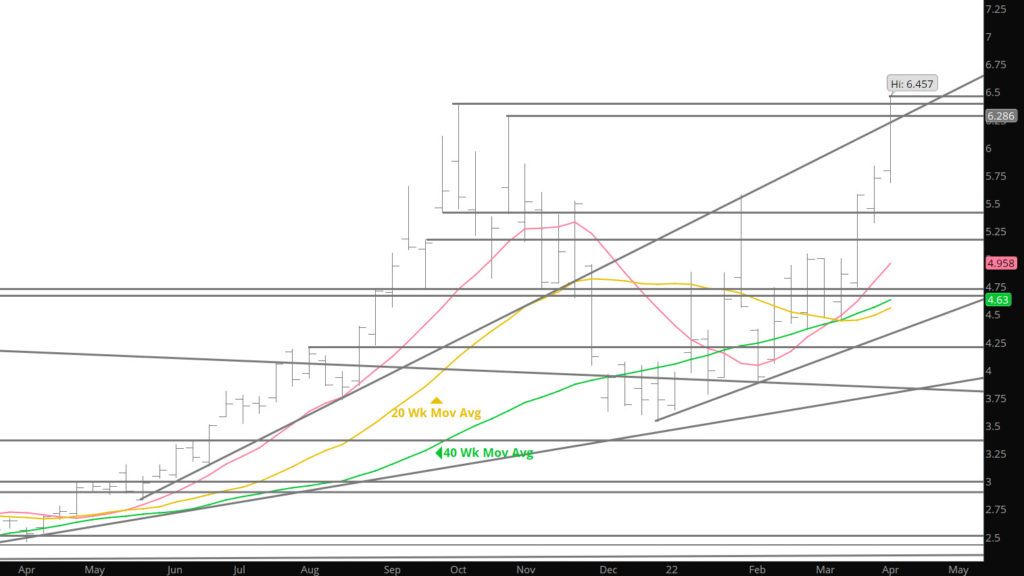
The run identified and discussed (on this website) continued early last week and continued the trend of setting a high, for the March contract, early in it’s prompt tenure. Taking prices up over $5.57, the market ran out of short covering and remaining winter bullishness to melt down a $1.00 in two days. I wrote in the daily last week that this year’s pattern was strikingly similar to 2014 and warned any bulls to tread softly. Now I will mention to the bears that this is unlikely a direct collapse to $4.00 as there are several areas of support between last week’s close and $4.00.

To read The Daily Call you must be a subscriber (Current members sign in here. ) Start your subscription today.

Impressive Expiration Strength

February Spot Contract

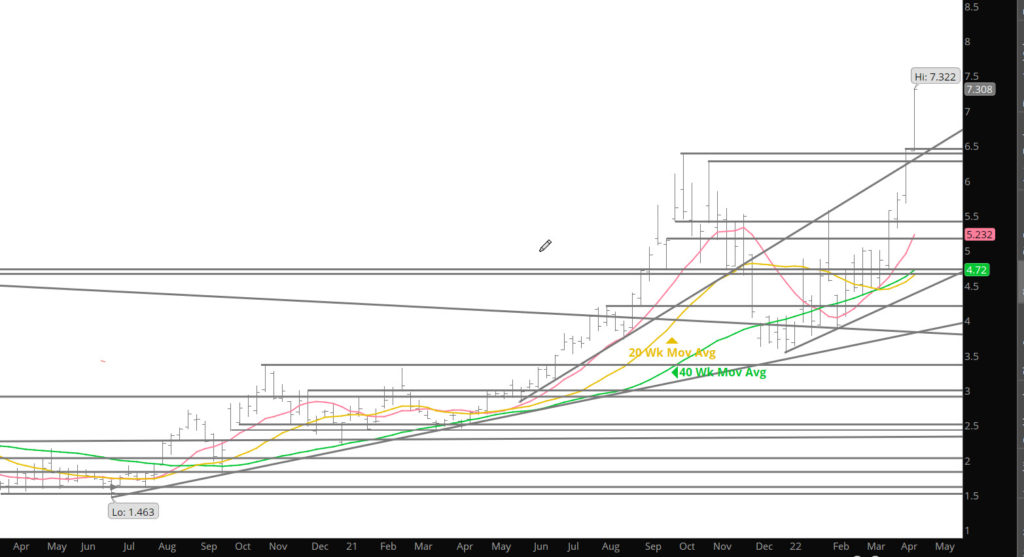
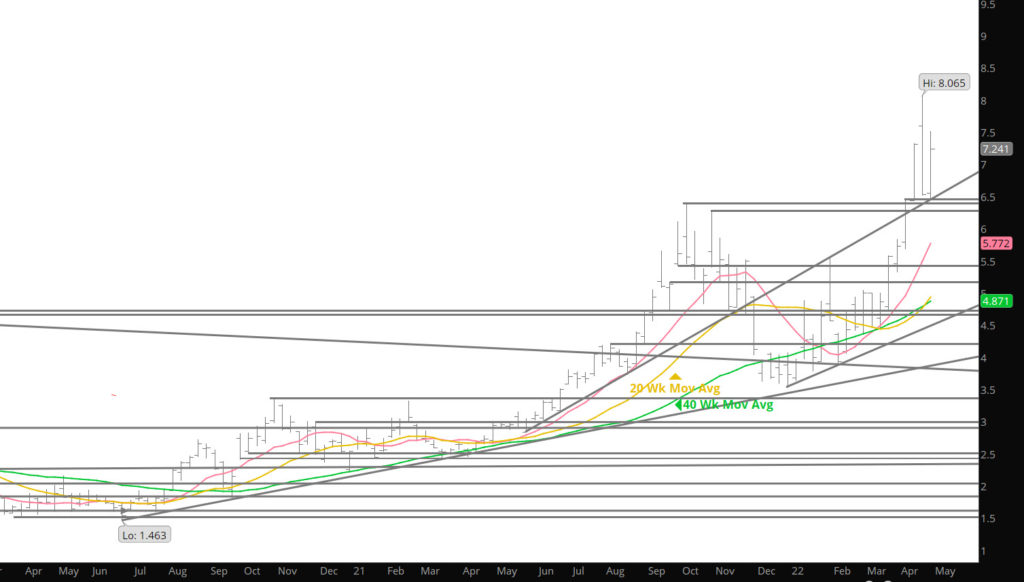
Some house keeping issues first— above you will see the expiration of the Feb contract and it trading as high as $7.346. Unfortunately, the charting software that I currently utilize does not consider the expiration day in its Continuation patterns. Because of that the Weekly continuation chart below does not have that day in its profile — I am going to seek a remedy to this situation this coming week and see what can be done.

Weekly Continuation

The expiration related price spike took February to 7.346…the highest price since October ’08, and it became the eleventh straight contract month to rally during the closing days of their tenure. February gas declined from the low volume spike to go off the board at 6.265, the highest since December ’08 gas settled at 6.888.

To read The Daily Call you must be a subscriber (Current members sign in here. ) Start your subscription today.

Expiration Week – Trend Continue?

Weekly Continuation

Last week’s close on some rebound strength (storage release weakness) gives hope to the bulls that the Feb contract will find its footing this coming week. Not believing in hope as a strategy, perhaps the market will resume the Thursday’s declines and test support from the Thursday low ($3.781) down to the $3.70 area before rebounding and and be well bid into into expiration for the 11th consecutive month. Following those expiration rallies none of the successor prompts continued to add substantially to the expiration related advances (October almost did) before retracing a chunk of the gain. January collapsed after December’s last day spike higher, February fell from 4.077 to 3.536 (a new continuation low and contract low daily close) after January was off the board before beginning to work higher. I can offer no explanation for this expiration phenomenon, only that history can present a trade strategy until it breaks trend. Prices may continue to rally from the Friday close, at which point the high from last week, around $4.39 (the false rally off of the long weekend), will present a solid target.

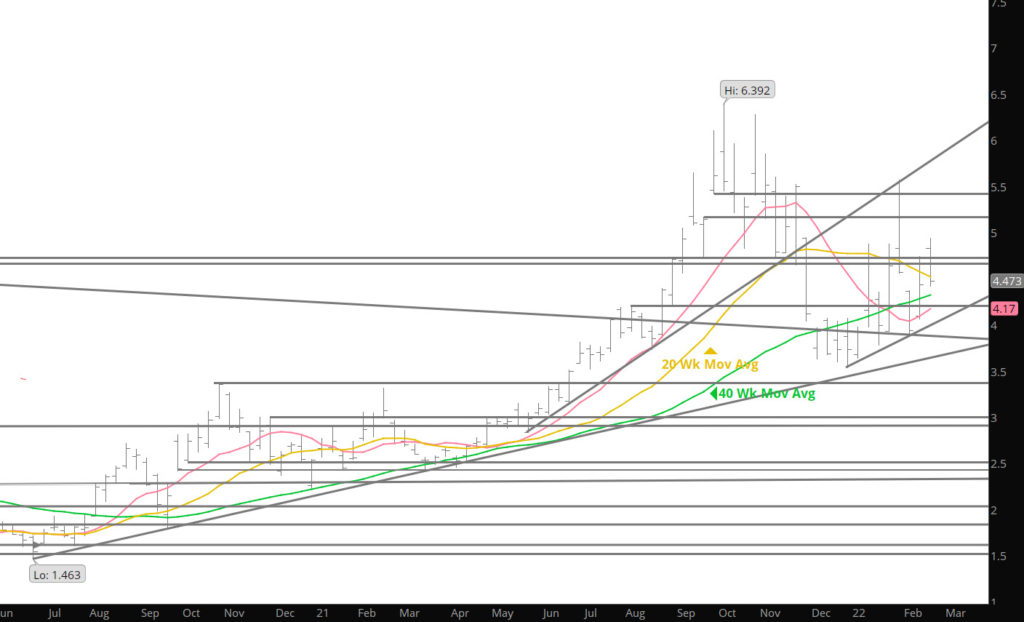
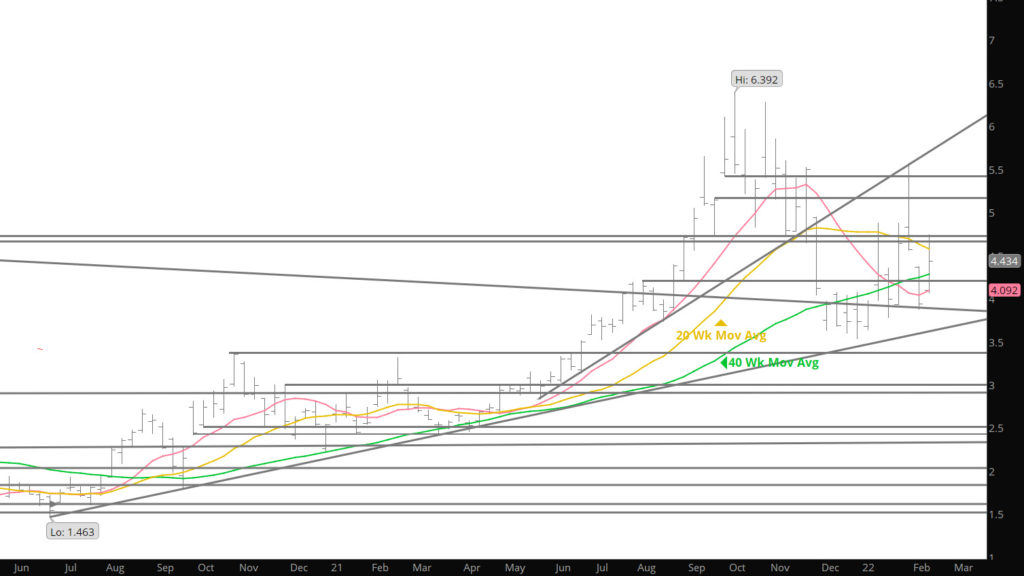
History provides that the last few days of trade in January and early February (March contract) have market a significant level (either high or low) for the tenure of March trade as prompt. From a long term perspective natural gas remains in a secular uptrend that began in June ’20 (discussed here since the fall ’20) defined by the trend line from that low found on the monthly continuation charts (below). Within that uptrend prompt gas has since early October been in an intermediate term down trend that has retraced 58.3% of the $5.034 rally from $1.432 to $6.466 (not quite a perfect Fibonacci 61.8% correction). As long as that secular uptrend remains in place– the appropriate strategy for trade is to work from the support levels defined from trade in the last year and selling the rallies at resistance.

To read The Daily Call you must be a subscriber (Current members sign in here. ) Start your subscription today.

Market Internals Start to Change

Weekly Continuation

The last couple of week’s I have discussed that the constant liquidation of open interest (last weeks open interest left the total number of contracts outstanding at a four – year low), had created upside vulnerability. The continuing decline in volume added to this potential instability.   Last week’s substantial increase in volume and open interest during the volatile trade brought about the realization of that vulnerability. It also suggests that the gas market has redefined support within its long – term recovery from the June ’20 multi – year low. It appears that prompt gas appears to have completed construction of a month – long base that likely includes a very significant intermediate term low.

The coming summer strip, which did not close below its 40 – week when the prompt and the one – year did (apart from one week during March ’21 the summer ’22 strip has remained above its 40 – week SMA since early July ’20, (see chart below) gained .342 and has a clearer path toward a test of its early November closing high.

To read The Daily Call you must be a subscriber (Current members sign in here. ) Start your subscription today.

Range Continues — Market Internals Signalling Potential Changes

Weekly Continuous

Prices continued the range that has held the market for five weeks now. During this time period there have been some internal development in the broader market that should be noted. First is open interest – it peaked in September at 1,468,636 contracts (during the extraordinary rally), and now has started to fall during the last three weeks of December. These declines have established a year end low of 1,108,463 (the lowest total of contracts outstanding in more than four years) while prompt gas has managed to post three weekly closes (3.690, 3.731 and 3.730). The inability to extend the lows further no several attempts suggests that the gas market has absorbed an historical liquidation and is likely run out of sellers.  High levels of open interest tend to occur when everyone wants to own some gas in anticipation of higher prices, low levels when few do. 

Some food for thought –A year ago prompt gas fell from an early November high to a pre – January expiration low of 2.238 on December 28th.  Since then that low has never been tested.  This year the February’s pre – New Year’s low traded on December 30th.  Interesting things often occur around the anniversaries of previous significant events. The summer strip has turned back higher without testing its 40 – week SMA all while prompt and winter prices have faced serious selling.

To read The Daily Call you must be a subscriber (Current members sign in here. ) Start your subscription today.

New Year’s History and Weekly Review

For whatever reason prompt gas has a habit of beginning (or in close proximity to the beginning) each new year with a significant event and more often than not, that event takes the form of a gap. Not sure if history will rhyme this year, but you may want to consider just a couple of factors:  1) In six of the last seven years began with a gap one way or the other, and far more important, 2) that the January high and low historically carry disproportionate importance.  For example, in 2019 the new prompt February gaped lower on the last trading day of the year.  That gap was filled and the January high traded on 01/15. That high held the market throughout the year.  The January ’19 low was not traded until the 29th…and was promptly violated on the first trading day of February.  In 2020, there was no gap but the rally in early Jan ’20 set the high for the year. Last year, the market had a gap at the end of December only to rally, rally with a gap at the new year, but prices never challenged the low from the late Dec gap. 

Again, based on all the history we have, whatever the January extremes turn out to be are going to be important to your planning for the year.  It is easy to lose sight of the importance of price levels traded early on.  Just about everyone in the market seems to have interest and more attention to short – term fluctuations but I encourage you to at least give price change during January your attention 

To read The Daily Call you must be a subscriber (Current members sign in here. ) Start your subscription today.