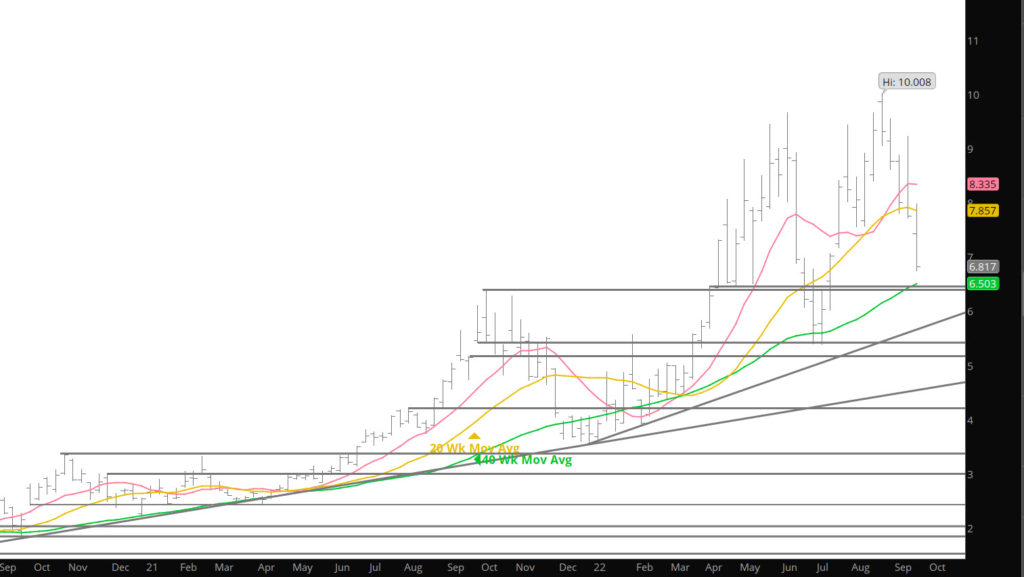
Wild Expiration Week With Potential Ramifications
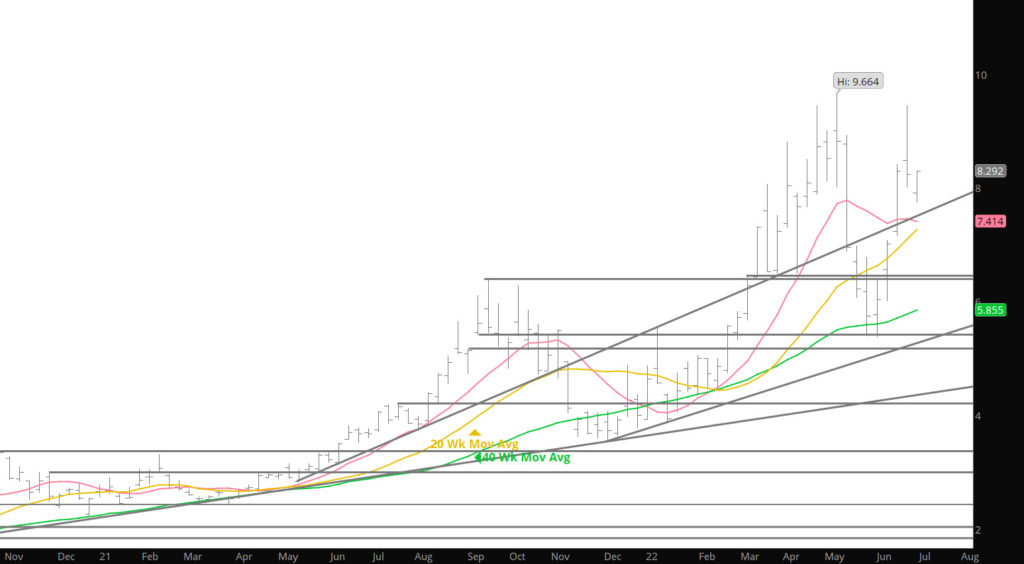
Weekly Continuation

First off– let me apologize for not providing a Weekly yesterday and this on will be brief as I am still trying to overcome a digestive issue that attacked on Sunday.

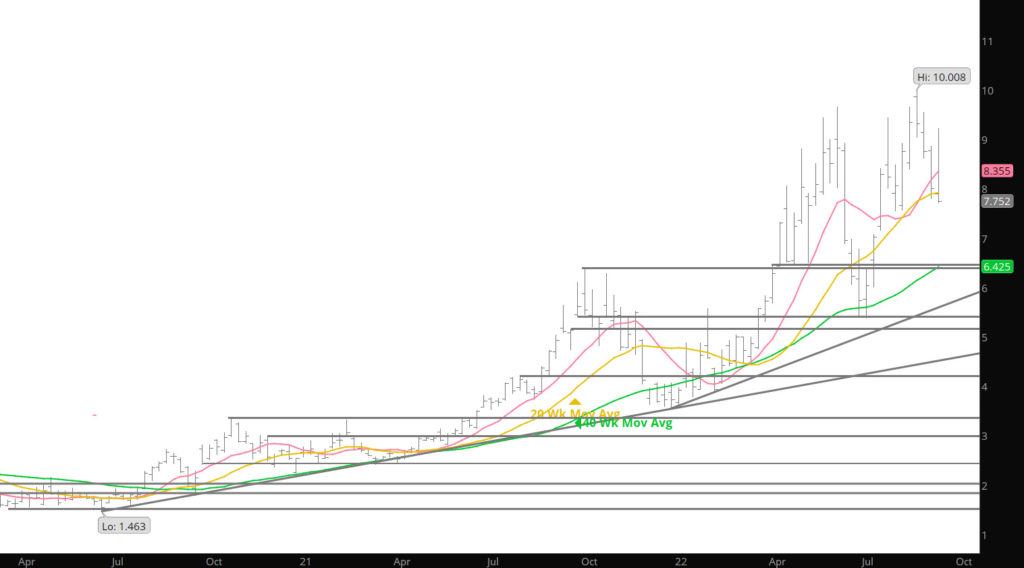
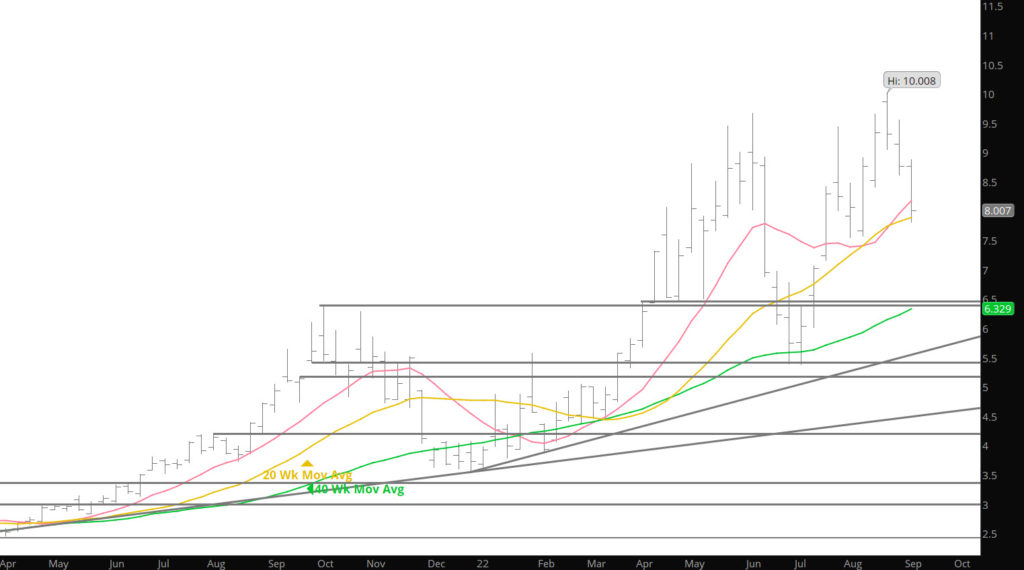
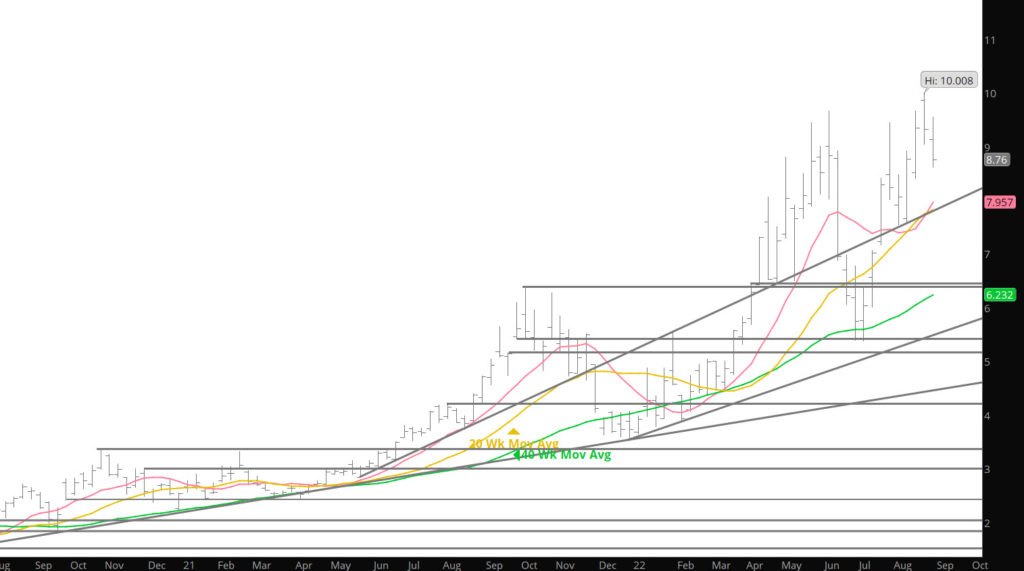
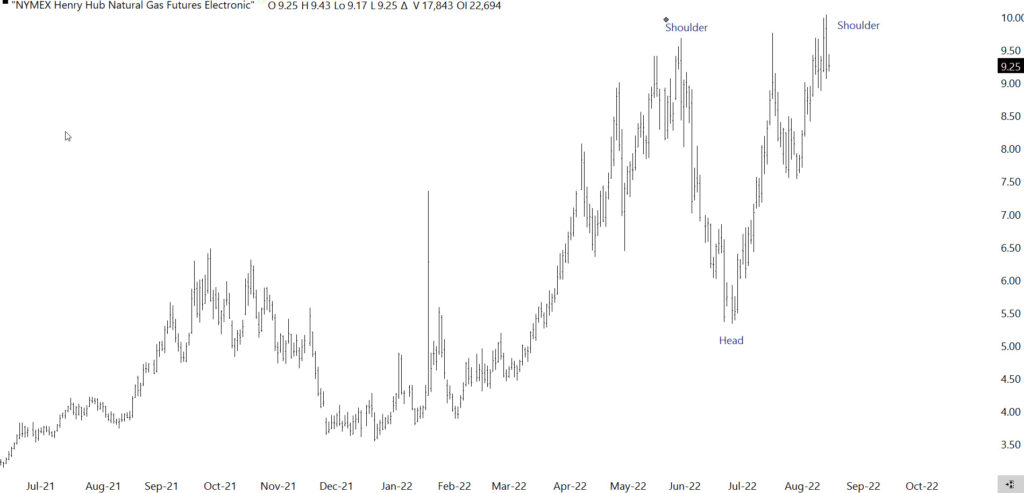
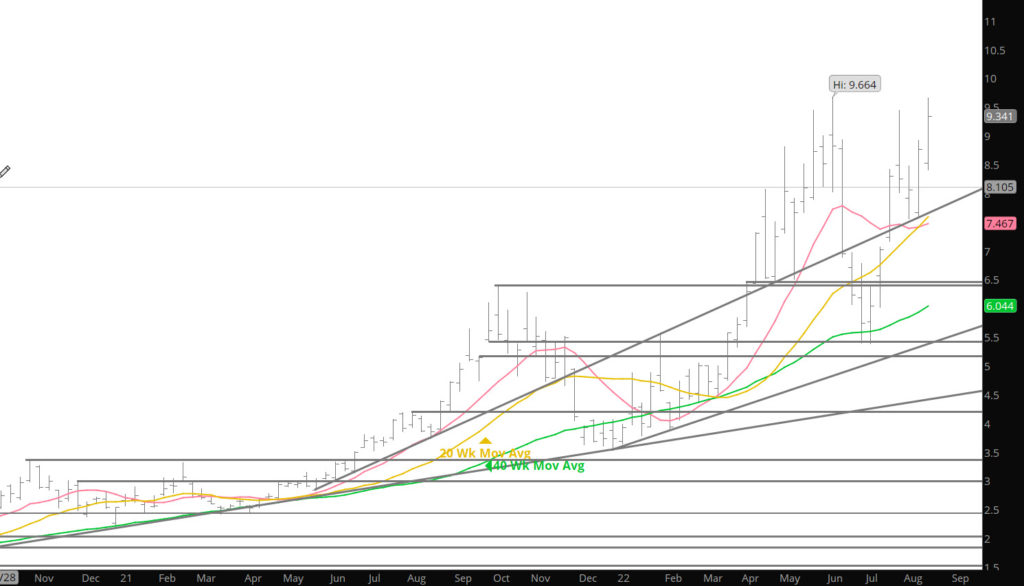
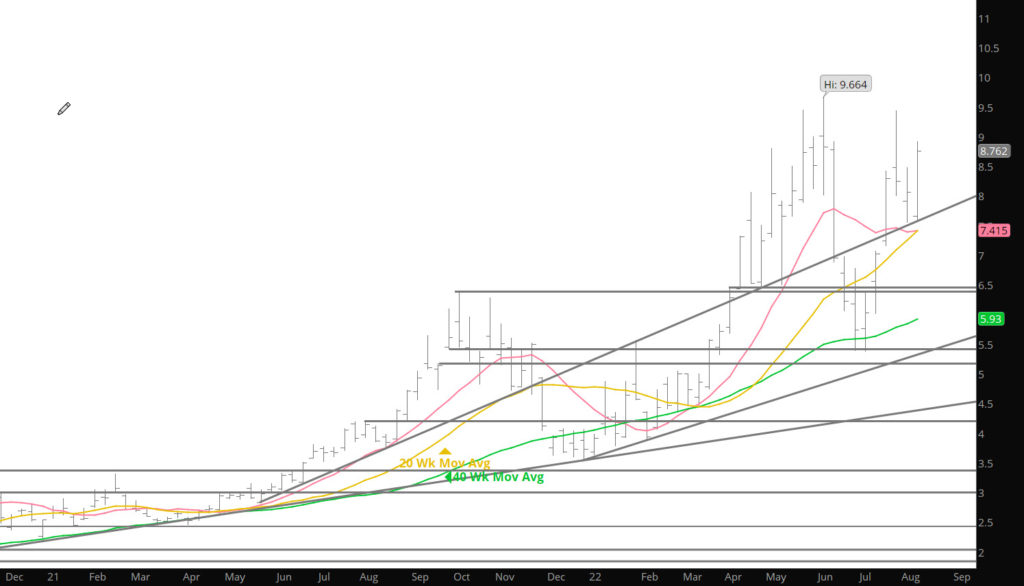
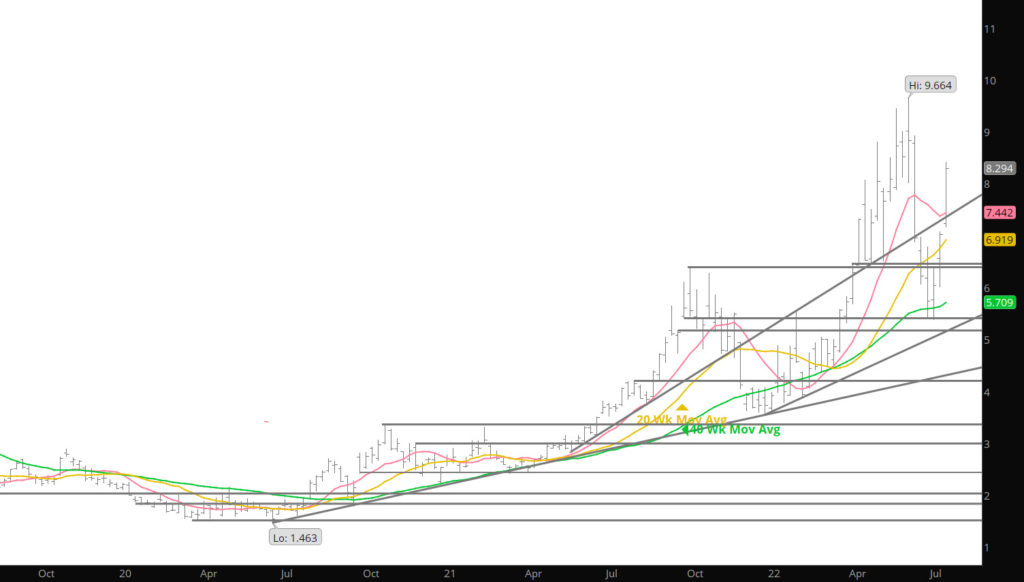
Consistent with the strength into expiration of almost every month for the last year and a half, expectations were that expiring August would be well – bid before going off the board. Just no one sent my an email that the trade during the past week trade through the June high. Yikes reminds me of the Feb expiration. Needless to say that the activity (primarily an out side month) created some historical technical issues that I will en devour to update on the importance later this week and into the fall.

To read The Daily Call you must be a subscriber (Current members sign in here. ) Start your subscription today.

Second Higher Weekly Close

Weekly Continuation

After trading to a high of $8.417 last week, prices closed the week at $8.299 for a gain of $1.283 (close to close). Clearly extraordinary gains over the last two weeks and left both the prompt August and September well above the commonly watched moving averages.

Despite this week’s strength, the consensus of technical indicators, failed to confirm the recovery with across the board in a positive (supportive) agreement. Due to the continued weakness in market internals- Open interest continued to decline as the market rallied. This week the total fell another +/- 20,000 contracts to the lowest level of participation since early 2016 – Average daily volume declined an estimated 20,000 contracts during the past week. Volume is currently less than the 50 – day average of contracts that has traded each day of the recovery from the 07/05 low with the exception of one. On 07/12 an “outside” day reversal to the downside was traded with the highest volume of any day during July. With the trading days remaining in calendar July, volume to date is estimated at 4,502,359 contracts while calendar June’s final total of 8,407,189– its is looking like July calendar trading has suffered very large volume losses compared to its predecessor.

To read The Daily Call you must be a subscriber (Current members sign in here. ) Start your subscription today.

Prices Extend Gains

Weekly Continuation

Prices continued the gains that commenced after July 4th, closing at a four week high. The run took prices over the 20 Week SMA (closing basis) after closing below it for the last three weeks. Over the last fifteen weeks (since early April), prompt gas has traded an average range of $1.334, during the week and only four of those weeks traded less than a dollar from low to high. Coincidentally, the average daily closing price for those seventy trading days is $7.366, the average weekly closing price $7.279. Hedging and speculation require levels of risk management and approaches impossible when the gas market trades nearly 20% of the average value of the contract each week. The inability to manage risk exposure causes participants to withdraw from the market, which further reduces open interest and liquidity. Perhaps volatility will diminish over the next couple of months as prompt gas constructs a series of higher lows and lower highs, developing the summer range discussed previously.

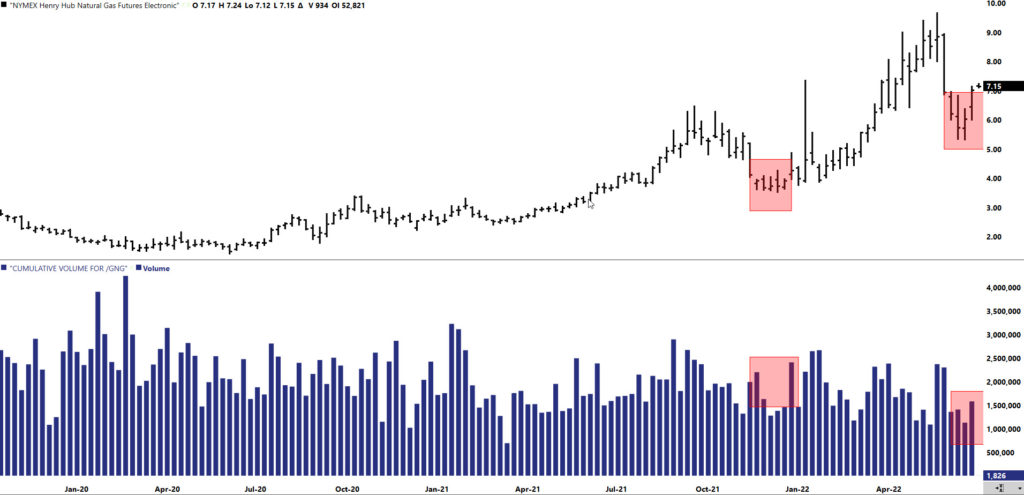
Weekly Continuous with Range Highlighted

The market has been here before recently. Look at the chart above, and notice the five weeks in December ’21 as the declines were dramatic up to a point and then a “range” developed, creating the consolidation for the break out above in January ’22. This period also had a decline in volume (lower half of the chart) until prices broke out and the volume exploded. A similar picture can be drawn from the current market (though only four weeks) as price consolidated (range trade) only to develop the momentum to move higher. Similar to last December, prices may not “take off” from here but any type of retracement to test initial support at $6.80ish and beyond around $6.42-$6.50 (spot) should be respected.

To read The Daily Call you must be a subscriber (Current members sign in here. ) Start your subscription today.

Definite Technical Damage

Weekly Continuation

Trade took prices through and close below first the short and then intermediate term trend lines (support). This move extinguished all but the long – term upside bias for prompt gas. Continue to expect wide trading ranges as the gas market attempts to define support. Prompt gas got way too far over its skis this spring and is making an extraordinarily volatile adjustment…retracing 50% of the rally from the June ’20 low in only sixteen trading days. While that decline/retracement extinguished the near term and intermediate term upside biases the long – term uptrend remains.

During the uptrend that first began following the June ’20 multi – year low a long series of higher highs and higher lows has been discussed here and was clearly observable. Short – term, intermediate – term and long – term trend has been definable with trend lines, by following moving averages and by seasonal and monthly lows. After flirting with violating the short – term uptrend in early May and early June, on 06/21 prompt gas decisively violated the trend line rising from the March – April lows and the 20 – day SMA. That decline and close ended the short – term uptrend. That decline and close ended the short – term uptrend. That same day prompt gas closed under the 50 – day SMA confirmed three days later. That violation was quickly followed by a close below the late April and May lows…the conventional support that comprised the last higher intermediate term low. Closes under the 50 – day and the May low ended the intermediate term uptrend.

To read The Daily Call you must be a subscriber (Current members sign in here. ) Start your subscription today.

Is the Bull Run Over?

Weekly Continuous

Price extended the losses and collapsed below the major support between the April and May lows ($6.247-$6.426) and closing the week below the higher low established during those months. This extension occurred with lower volume (partially due to the holiday), but more important is the decline in open interest. The market is now at the lowest level of open interest since the collapse in Jan ’16 and the Q3 low established in Jul’16. Notice that both of those were lows as the market was struggling with declines and position by the hedging community. Similar to current conditions as traders are not sure how to deal with the one year effects from the war and the LNG situation. It is clear that the recent collapse was partially due to a re-assessment by the fundamental condition from LNG demand loosing 2 Bcf/day (displacing that gas into storage) and the destruction of technical support levels.

So is the bull run over –not sure as if you look at the last lower low, in the chart below, prices traded around the lows for three weeks before breaking out to the upside (2nd chart below).

To read The Daily Call you must be a subscriber (Current members sign in here. ) Start your subscription today.

Substantive Declines Modify Short Term Bias

Weekly Continuation

On Wednesday June8th, dropped over a dollar in just one hour.  Not to be out done, on Tuesday of last week, July surpassed that unusual event by declining $1.588 (from $8.609 to $7.041) in an hour.Substantial declines, by the prompt contract in the couple of weeks (all from a similar resistance area) should tell us something about the demand for futures contracts on either side on $9. 

This past week total open interest fell 42,829 contracts (through Thursday) bringing the two – week total decline to 84,767…the lowest number of futures contracts outstanding since Labor Day 2016.  It has been discussed here on several occasions, during the rally of ’22 that the level of open interest has contributed mightily to price volatility…both to the upside and downside.  Given the continued lack of participation in hedging, either long or short, expect continued price volatility. 

To read The Daily Call you must be a subscriber (Current members sign in here. ) Start your subscription today.

Wild Volatility

Weekly Continuous

Last week was quite something as a new Q2 high was traded on Wed, through the May high (prompt gas has now traded $6.128 or 173.3% above the December 30th – “Q1” low) and then through last week’s low. On Wednesday July dropped $1.119 (from 9.546 to 8.427) in just an hour. Yee Haw.

In past weeks the historical seasonal pattern of prompt gas between around the Memorial holiday (05/15 and 06/15) has been discussed. Over the years prompt gas has consistently traded a pre – Memorial Day high, fallen to a post – holiday/early June low and then rallied into mid – June. June before going off the board and July since has essentially followed the historical script with astounding and uncharacteristic volatility. The ten – years average of early June rallies is 16.65%. From Thursday’s (06/09) low July rallied 14.1%.

To read The Daily Call you must be a subscriber (Current members sign in here. ) Start your subscription today.

Limited Weekly Continued Bullish Bias

Weekly Continuation

Traveling today, Sunday, and the internet is sporadic. Prices declined on Friday after the close so would expect additional weakness on Monday. Will give more of an update to the coming week tomorrow for publish on Tuesday.

Major Support:$$8.73, 8.283-$8.24, $8.12
Minor Support: $8.065,
$7.69,$7.36,
Major Resistance: $9.447, $9.60

To read The Daily Call you must be a subscriber (Current members sign in here. ) Start your subscription today.

Holiday Weakness Plays Out

Weekly Continuous

Historical Holiday weakness trend was right on cue last week. After a bid not far from Friday’s high when trading resumed prompt gas fell from $8.916 to $8.118 where support was generated from the rising 20 – day SMA (not commonly sighted here). July recovered from that test of support and traded all the way back to definable resistance just short of $9 (as discussed in the Daily last week), reversed lower and spent the remainder of the holiday shortened week churning between the two extremes, ending the week about in the middle.

The momentum divergences discussed here in previous weeks continued while market internals continued to deteriorate The momentum divergences discussed in previous weeks continues to exist and provide additional curiosity. For example, this week each day that price rallied to close higher, the volume declined –while it accelerated when price fell. With prices lower from Thursday to Thursday open interest (data lags by a day) increased nearly 19,000 contracts, suggesting larger positioning on the short side. When a market is in a healthy trend volume, open interest and price will move in the same direction (similar to the December and March lows), right now the opposite is prevalent. In summary for May–prompt gas ended May $.901 higher than on the last trading day of April while volume fell significantly. Open interest also declined during May (from 1,138,850 to 1,115,815). Rising prices – falling volume – falling open interest is a combination that is not likely to continue and underscore a problem within the market..

To read The Daily Call you must be a subscriber (Current members sign in here. ) Start your subscription today.

The Trend Is Your Friend — Until It Isn’t

Weekly Continuation

No surprising last week that June gas was well – bid into expiration and June was the fifteenth straight contract to enjoy increased buying during the last few days of its prompt life. What was surprising that the last support took prices through the early May high for June gas. The recent trends have had support tested after the start of trade month and last month was no exception as, June gave buyers a chance to buy weakness when it plunged from the aforementioned early calendar May high. As long as the tend and process of higher lows and higher highs (a primary characteristic of a longer term trend and discussed here for several months) continues it is likely that there will be a brief correction to the July prompt in the coming weeks. Whether it falls $2.566 (like prompt June gas) in less than three trading days, remains to be seen.

History tells us there is a consistent pattern that brackets Memorial Day Holiday. That pattern has, prompt gas setting a high between mid/late May and then declines to an early/mid – June low then rallies toward an early summer high. The average of the declines since ’00 is 11% – 12%. The 10 – year average of rallies from June lows is 16.65%. From the high traded last week at $9.447 to the low on May 27th ($8.285) represents a 12.3% decline well within the average. Not stating that the Holiday low has been established, but the current decline has met the average decline.

To read The Daily Call you must be a subscriber (Current members sign in here. ) Start your subscription today.