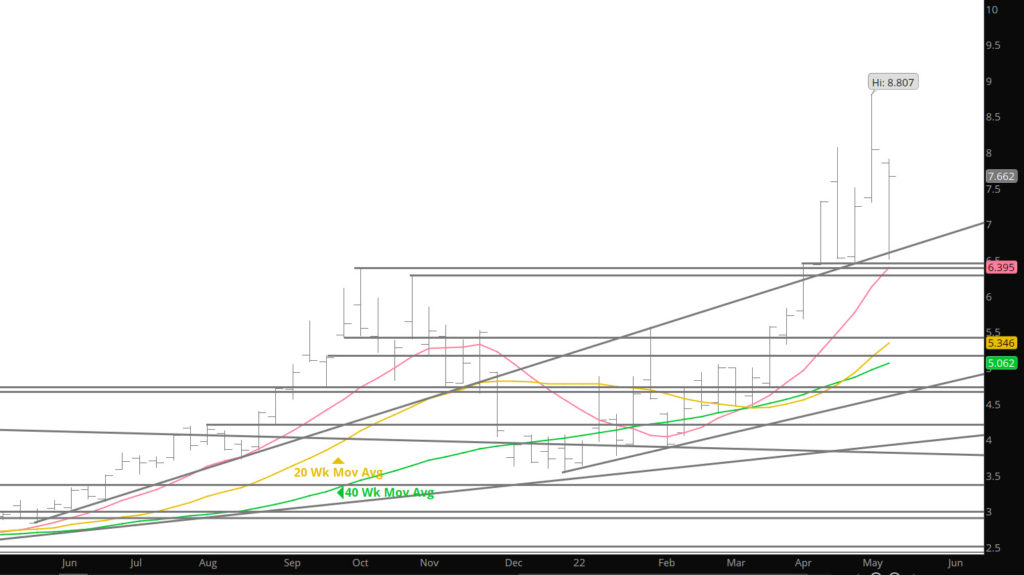
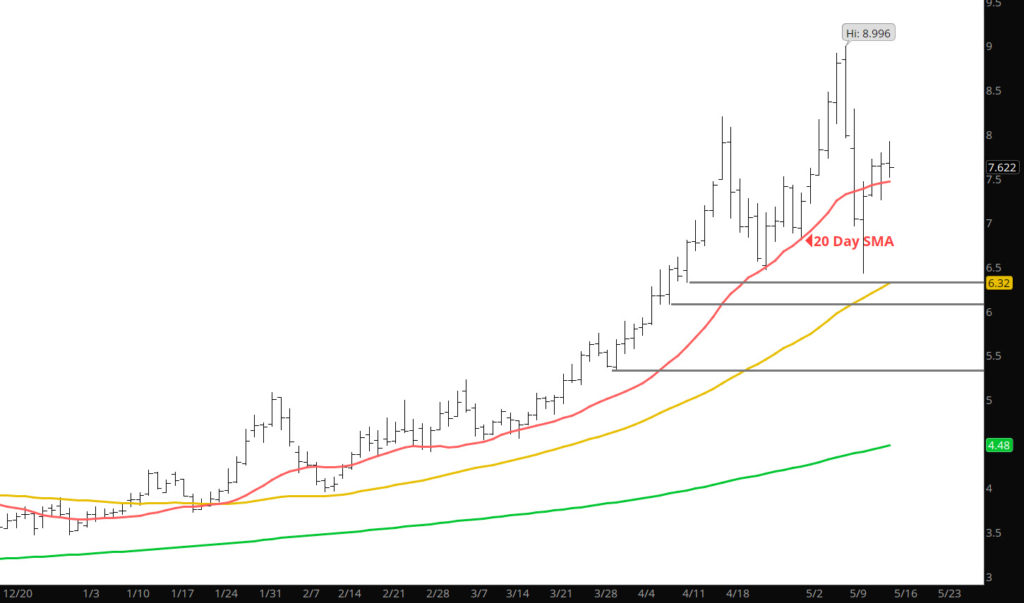
From the previous week’s reversal, prices gaped lower at the open last week (though quickly filled) continued a decline that extended down to the lows $2.566 below previous last Friday’s reversal high, and testing support presented by the April low ($6.345 last higher low), and into a zone between the September and October ’21 highs ($6.280 – $6.466. From the December low ($3.536) to the May 6th high ($8.996) prompt gas has rallied $5.43 or 153.6%. The second largest in terms of price increase; the largest in terms of percentage increase in the history of natural gas trading (more history below).
Market internals continued to show divergence two weeks ago. This last week volume accelerated as the market fell (Monday and Tues), then declined as it recovered. Open interest declined for five straight days while price fell (from Thursday to Thursday losing nearly 31,000 contracts), bringing the total decline to more than 80,000 since mid – April. Lower level of open interest can create more volatility (less positions to be defended). A more significant technical issue is that neither volume nor open interest has confirmed the April OR May highs. Higher price highs without higher volume or open interest is a significant price negative divergence. The weekly RSI has formed the classic divergence as the higher Weekly high during the week of May 2nd (Friday the 6th) did not confirm with a higher high level.