Price extended the losses and collapsed below the major support between the April and May lows ($6.247-$6.426) and closing the week below the higher low established during those months. This extension occurred with lower volume (partially due to the holiday), but more important is the decline in open interest. The market is now at the lowest level of open interest since the collapse in Jan ’16 and the Q3 low established in Jul’16. Notice that both of those were lows as the market was struggling with declines and position by the hedging community. Similar to current conditions as traders are not sure how to deal with the one year effects from the war and the LNG situation. It is clear that the recent collapse was partially due to a re-assessment by the fundamental condition from LNG demand loosing 2 Bcf/day (displacing that gas into storage) and the destruction of technical support levels.
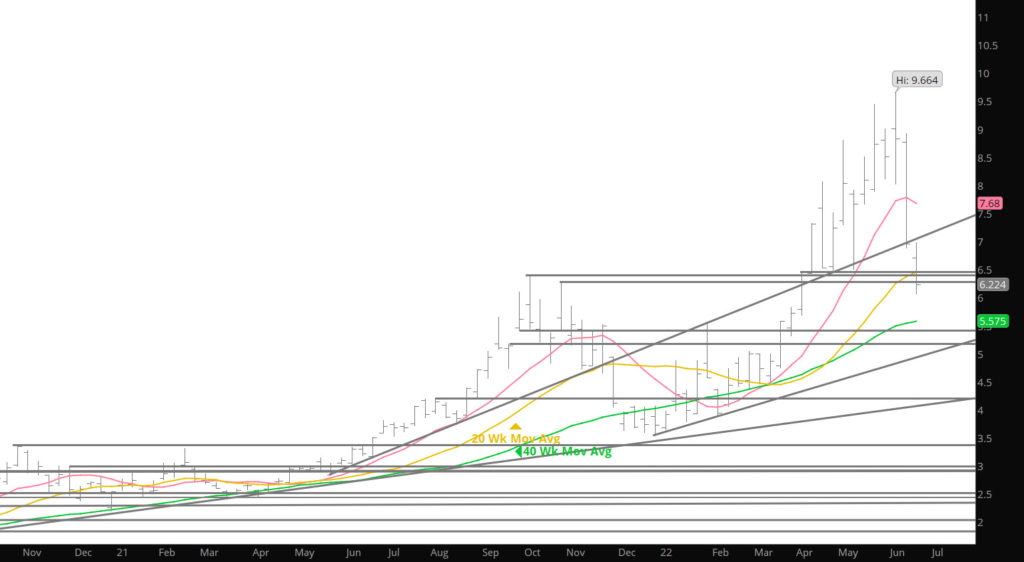
So is the bull run over –not sure as if you look at the last lower low, in the chart below, prices traded around the lows for three weeks before breaking out to the upside (2nd chart below).