To read The Daily Call you must be a subscriber (Current members sign in here. ) Start your subscription today.
Category: Weekly Detail
September High for November Remains
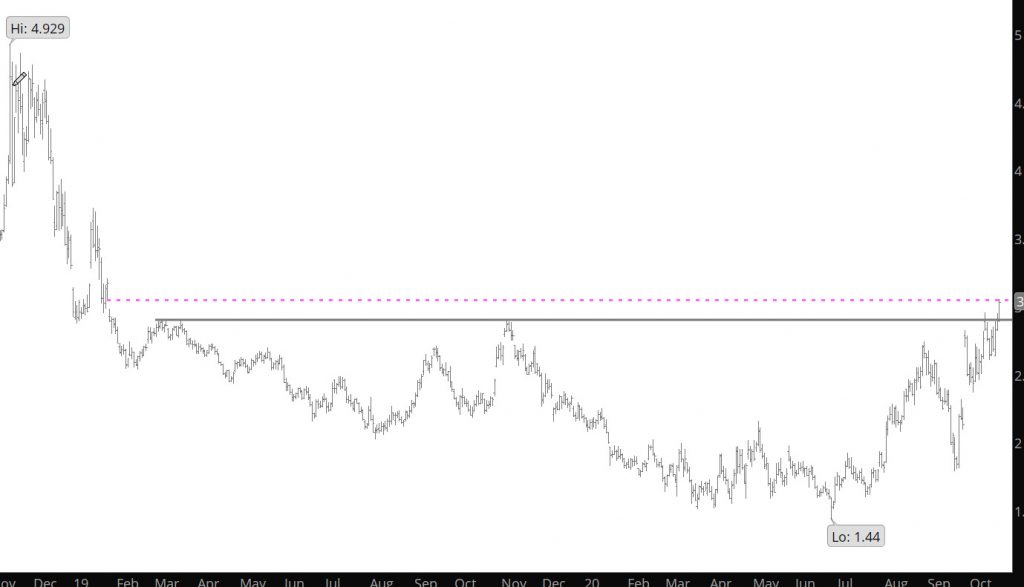
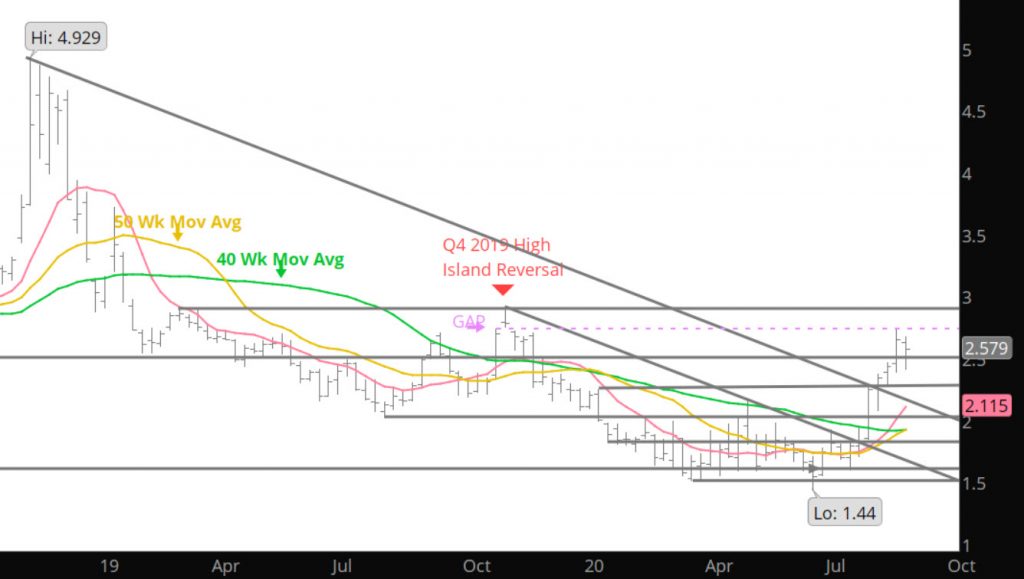
The high for November gas printed just over $3.00 in early September and while last week provided a marginal attempt to get back to that level, the rally failed reversing and closing near the lows (in fact after the regular session was finished the late afternoon traded much lower). The late declines took prices to close just about on the 10 week SMA. The week’s action occurred on lighter volume and declining open interest (highest volume on the declines).
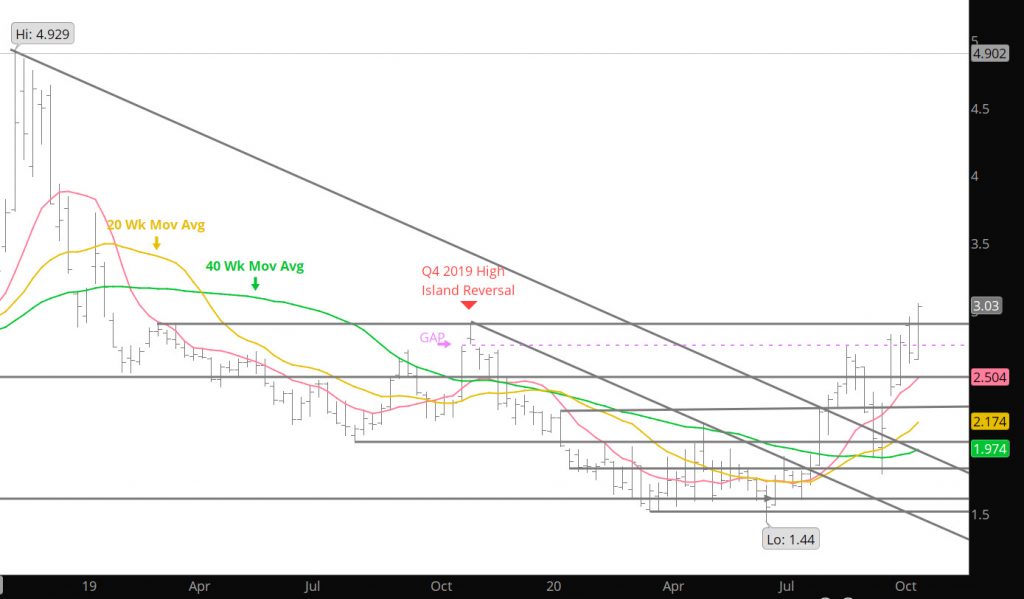
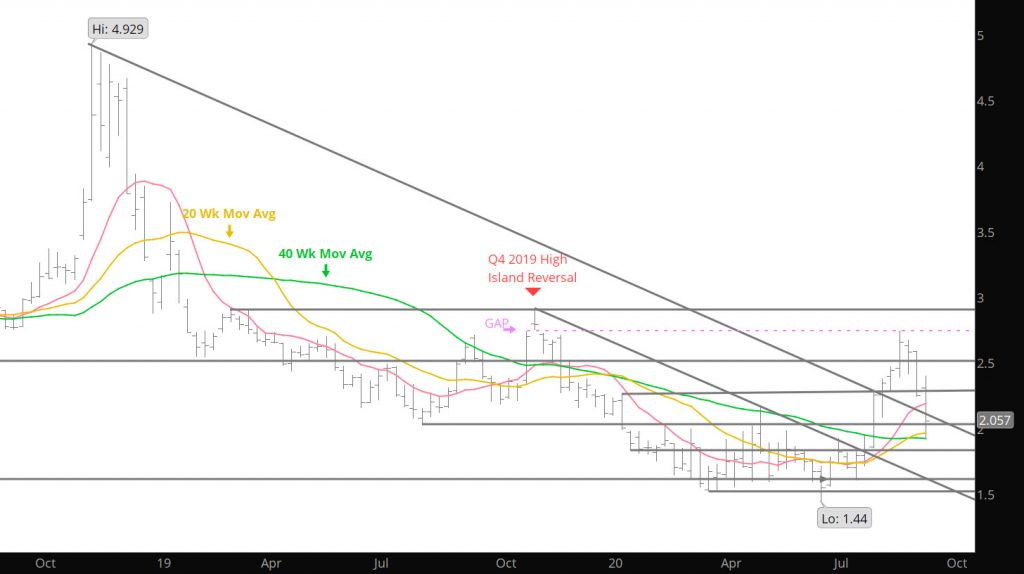
Since prior to the beginning of November’s tenure as prompt it has presented a volatile trading range (basically +/-$2.40 – $2.90). Trade gave up the a significant portion of the substantial premium awarded at October expiration. Action then had November trading through its September low (and its 200 – day SMA) before regaining that SMA, and significantly more, when it traded to a higher continuation high at $2.955. This failure at both of the extremes suggests that the volatile range will continue through the remainder of the November contract. This price behavior will mimic other years when there has been such a significant premium.
While the Nov contract has traded in a volatile range ($+.55) this month the differed contracts have not provided the same level of volatility. December traded within a +$.35 range since the expiration of the Oct contract and similar narrower ranges occurred in the other winter differed contracts. I will be going into the open interest and volume of the differed contracts during the week so be sure to check.
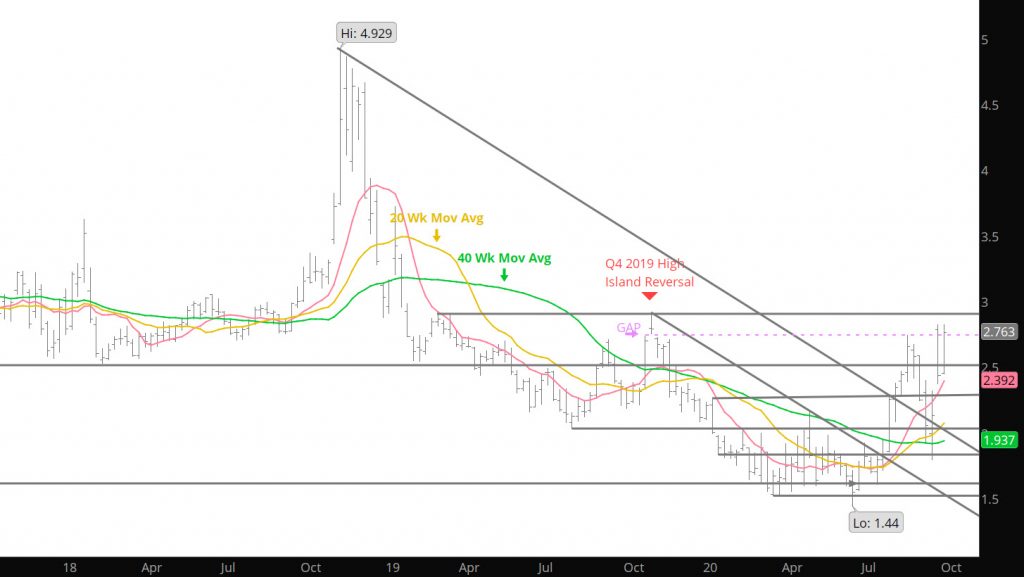
Major Support: $2.476-$2.446, $2.392,$2.258-$2.253, $2.219
Minor Support: $2.618, $2.508, $2.339
Major Resistance: $2.789-$2.801,$2.908-$2.928,$2.973-$3.00
After Weak Start — Nov Firms
To read The Daily Call you must be a subscriber (Current members sign in here. ) Start your subscription today.
Prices Converge on the Premium to Nov
To read The Daily Call you must be a subscriber (Current members sign in here. ) Start your subscription today.
Start of the Winter Contracts
To read The Daily Call you must be a subscriber (Current members sign in here. ) Start your subscription today.
Prices Return to the Mean
To read The Daily Call you must be a subscriber (Current members sign in here. ) Start your subscription today.
Prices Retrace on Cue
To read The Daily Call you must be a subscriber (Current members sign in here. ) Start your subscription today.
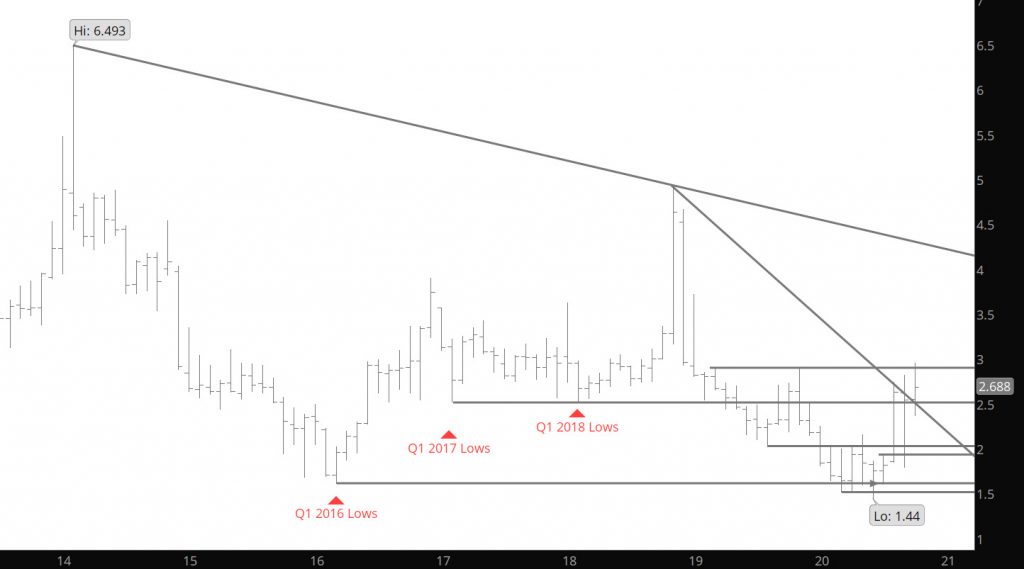
Looking At History
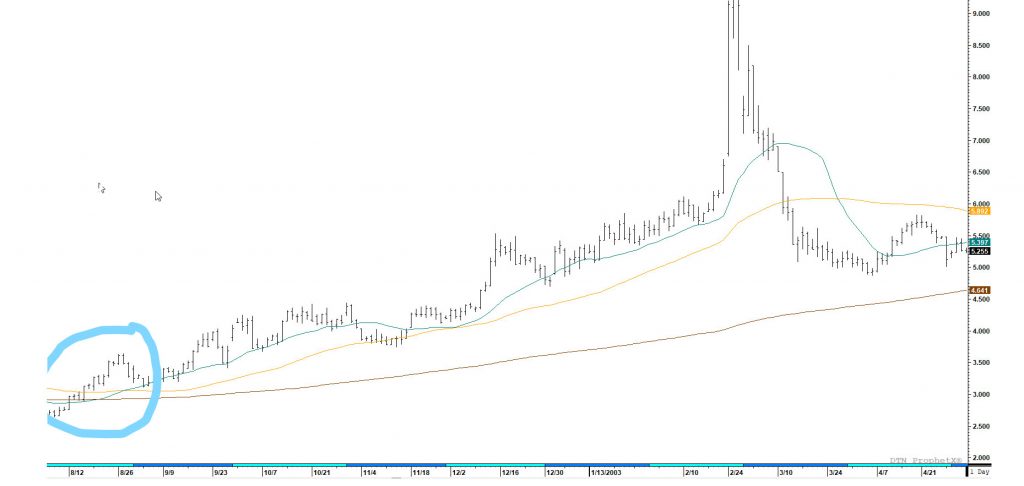
Highlighted three years that prices stayed strong during August, but I wanted to focus on 2002, as the spread between October and November expanded to over $.40 in early September, which is similar to this year.
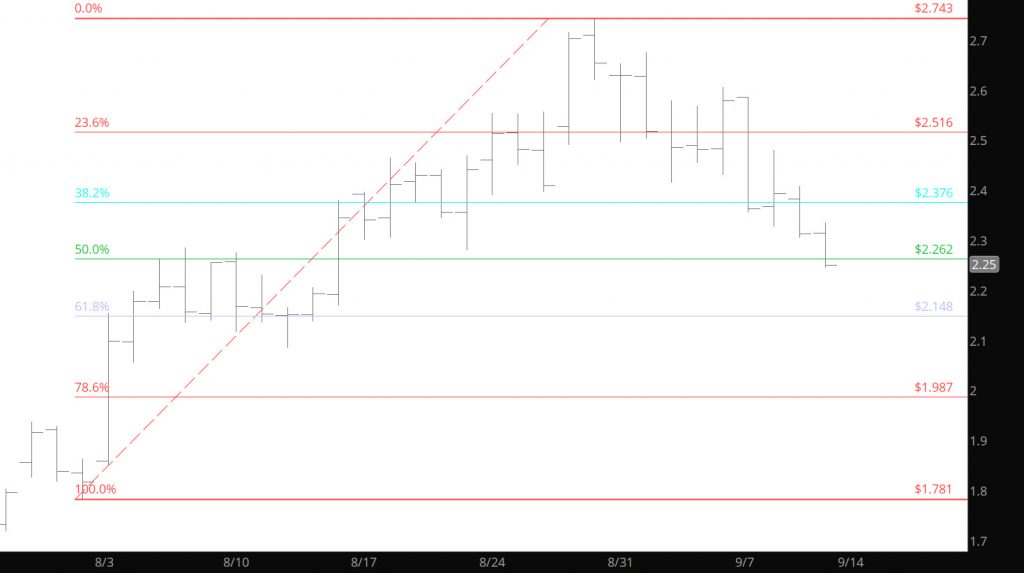
Notice that the solid gains during the August month in 2002 (blue circle), prices then retracted 14.6%, before extending on a long term rally that didn’t conclude until February ’03. While that started, the spread between Oct and Nov contracts expanded to $.40 (premium Nov) during early Sept. Similar to the current year, prices held firm all during the August trade and currently trade $.45 differential to the November contract. The recent declines from the highs at $2.743 have corrected 14.7% at the lows yesterday. In 2002, the market did not correct until Feb 2003 as prices skyrocketed. Not sure if this occurs in 2020 but wanted to bring history to your attention.
Differed Contracts Remain Powerful
To read The Daily Call you must be a subscriber (Current members sign in here. ) Start your subscription today.
Market Continues Consolidation
To read The Daily Call you must be a subscriber (Current members sign in here. ) Start your subscription today.