
To read The Daily Call you must be a subscriber (Current members sign in here. )
Category: Weekly Detail
2021 Commences With Gap
To read The Daily Call you must be a subscriber (Current members sign in here. )
Early January Trade Has History
To read The Daily Call you must be a subscriber (Current members sign in here. )
Prices Likely to Test Support Gap
To read The Daily Call you must be a subscriber (Current members sign in here. )
Where Does It End

To read The Daily Call you must be a subscriber (Current members sign in here. )
Action Consolidates Above Key Moving Average
To read The Daily Call you must be a subscriber (Current members sign in here. )
Support Challenged — Declines Failed
To read The Daily Call you must be a subscriber (Current members sign in here. )
Those Early Winter Calls for the “End of Winter”
To read The Daily Call you must be a subscriber (Current members sign in here. )
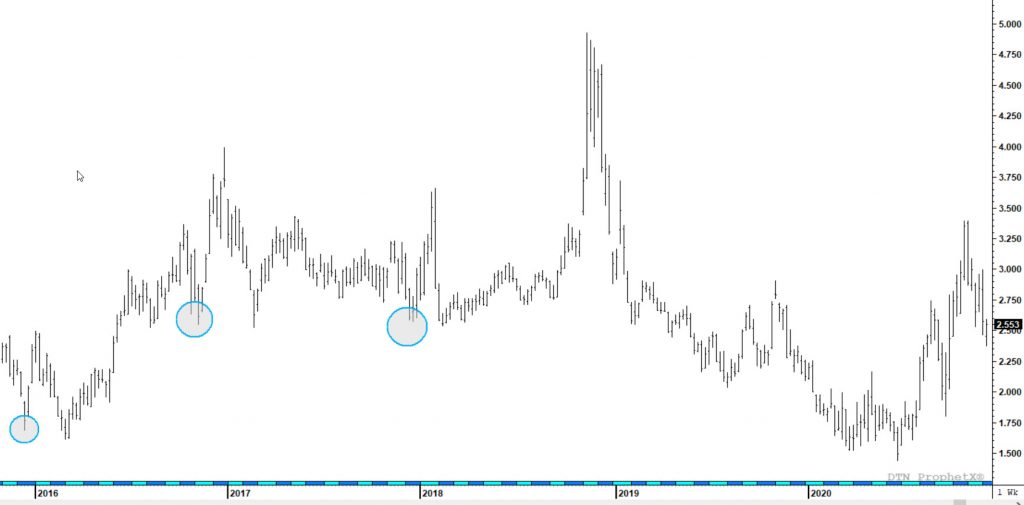
Break Down Tests the ’18 and ’17 Q1 Lows
To read The Daily Call you must be a subscriber (Current members sign in here. )
Two Trends Within the Market
Going into some technical weeds this week as the market is sending two messages at the same time. The first message that most traders track is the short / intermediate term and the second is the long term analysis which drives potentially more accurate expectations of where the market is headed (bullish or bearish) with out the noise from daily position changes and weather impacts.
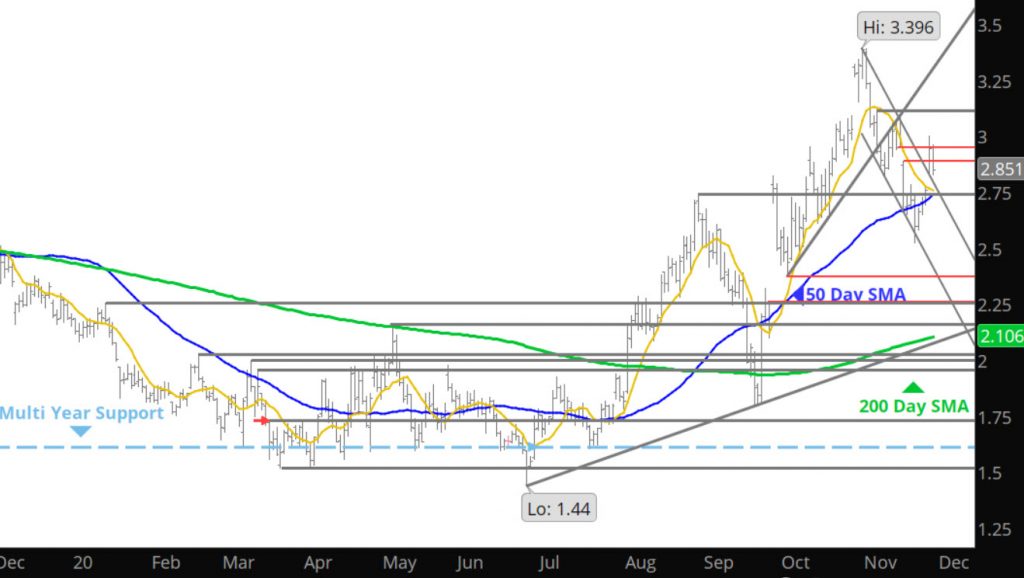
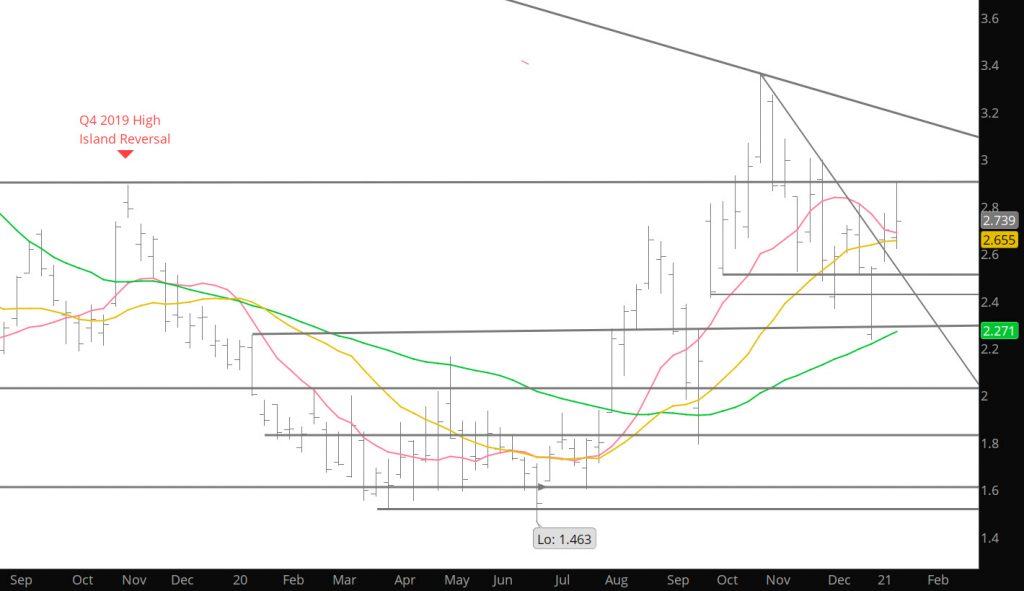
Discussed last week that the market was bordered by two gaps, one to the upside which was remnants of the collapse two weeks ago on a Monday and the other to the downside, remnants of the premium afforded the November contract which has yet to be closed. The upper gap was closed in nine days as the expiring December contract and January prompt traded in and through late last week (with Dec remaining well bid all through the three days). By failing on Friday after taking over as prompt, the short term interpretation remains bearish after the collapse two weeks ago.
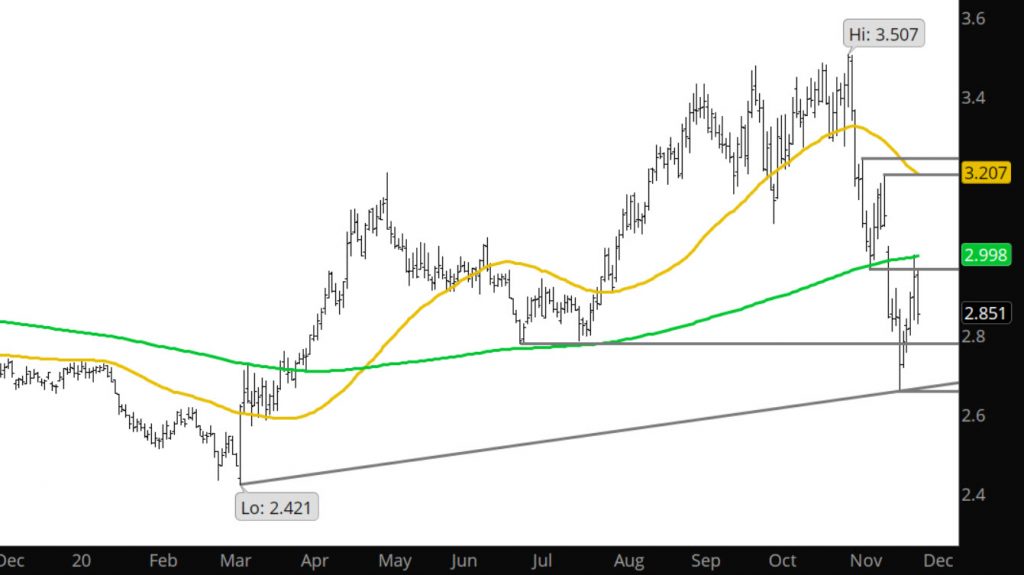
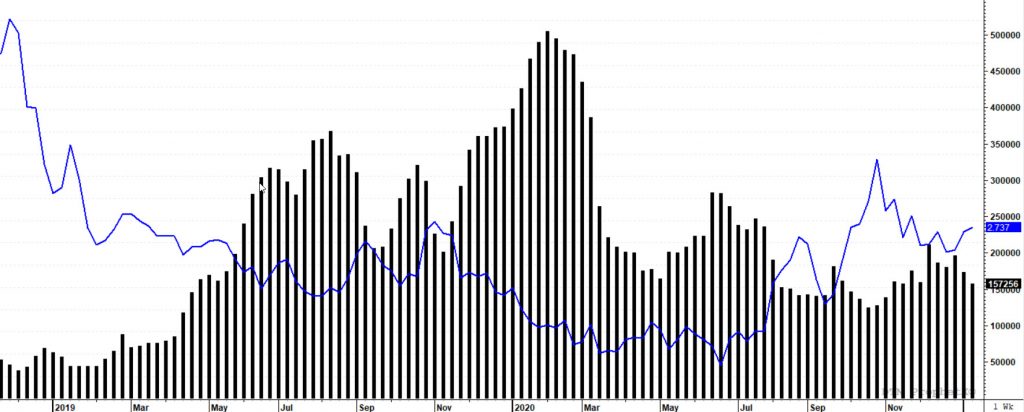
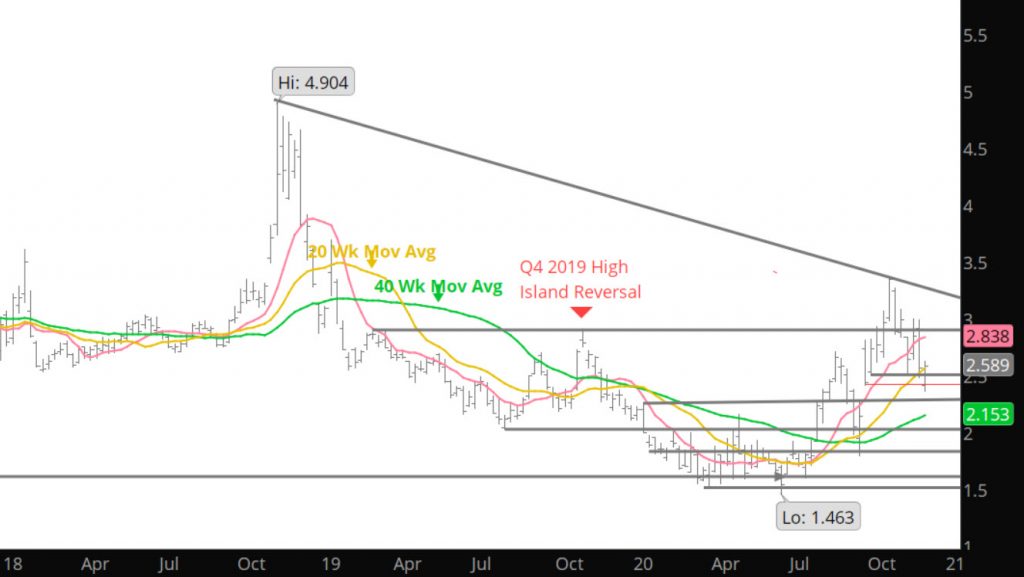
The image above shows just how bearish the short term is for the Jan chart as another gap was formed between $3.022 and $3.074 that was not even challenged during the well bid Dec expiration– in fact the 200 day SMA for the Jan contract was resistance below the gap. While last week’s reversal (impressive counter rally) off of the lowest price since last spring, the event occurred on significantly lower volume (holiday week) and declining open interest (expected with expiration).
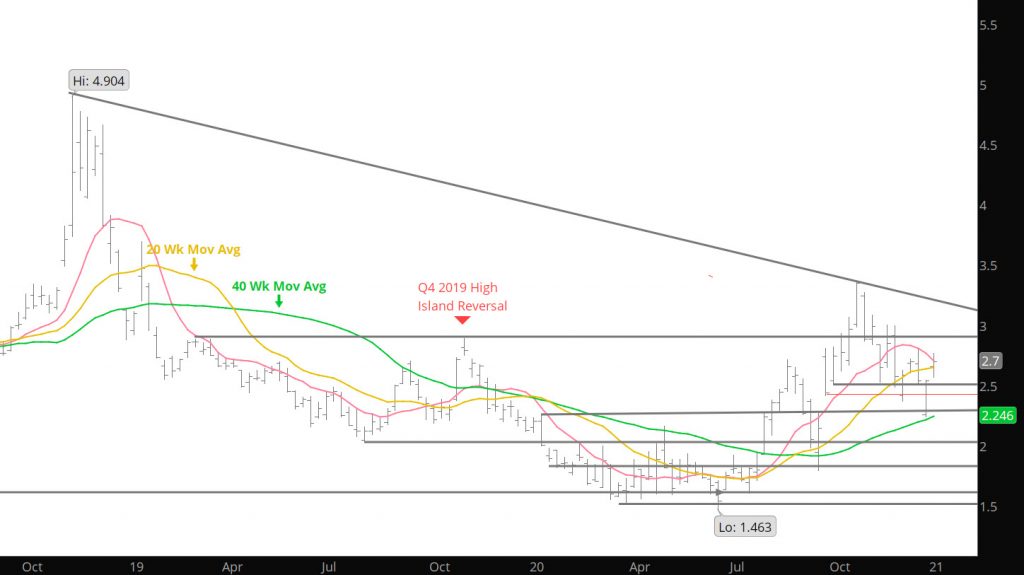
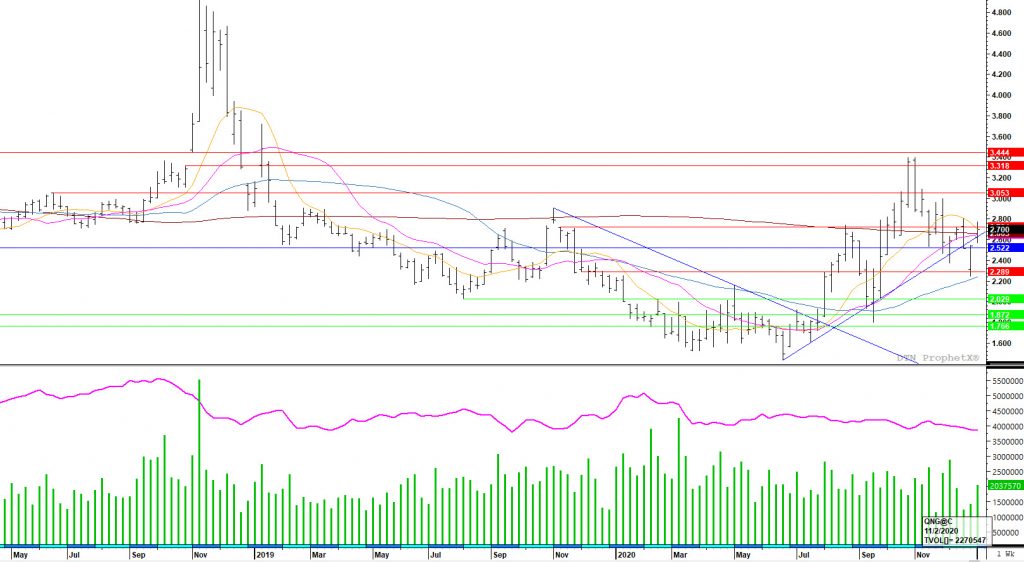
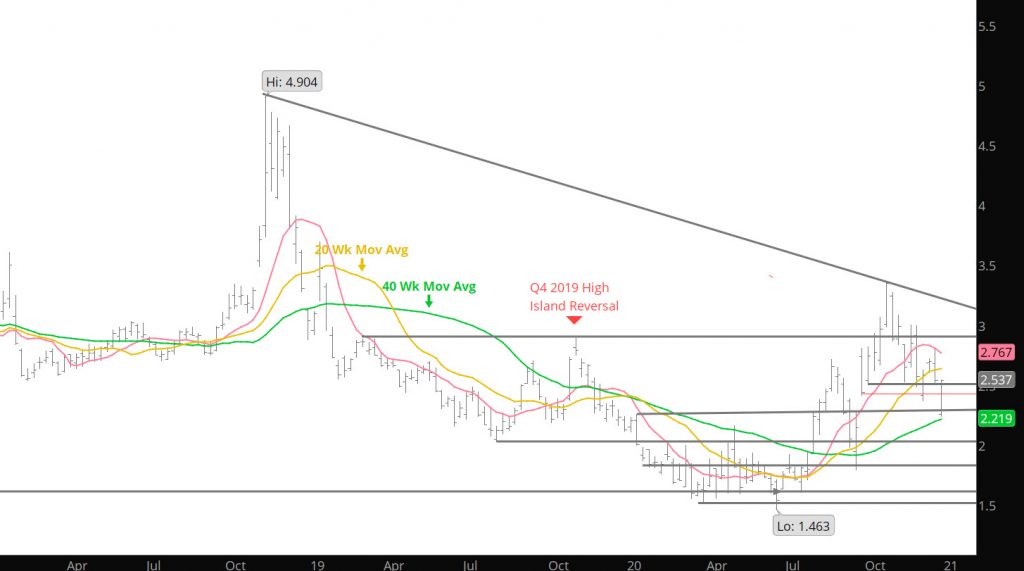
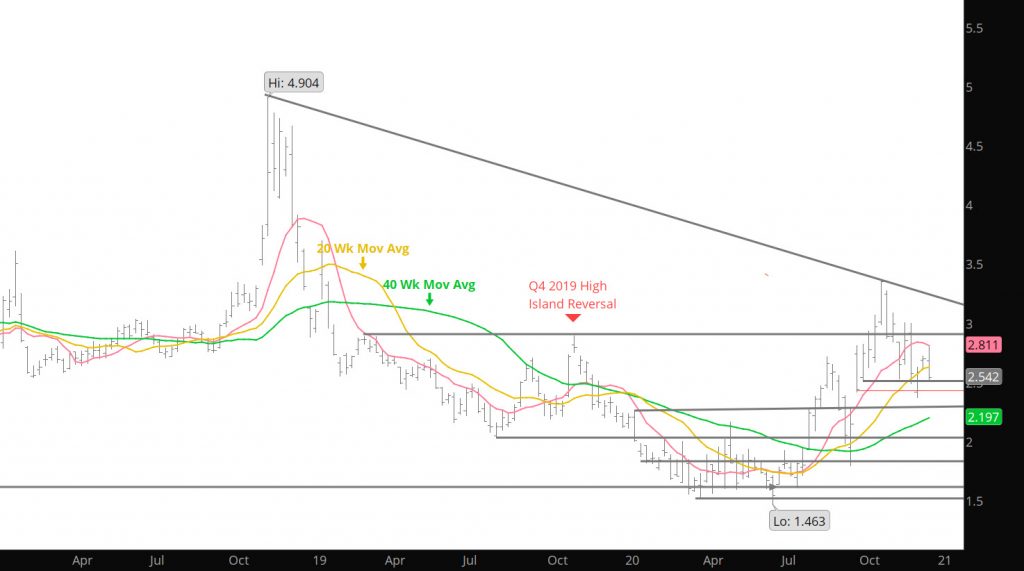
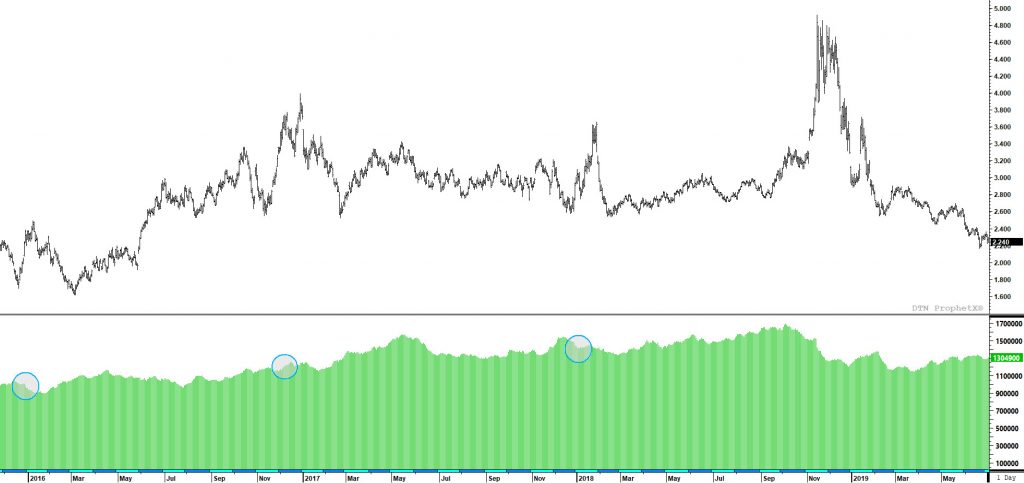
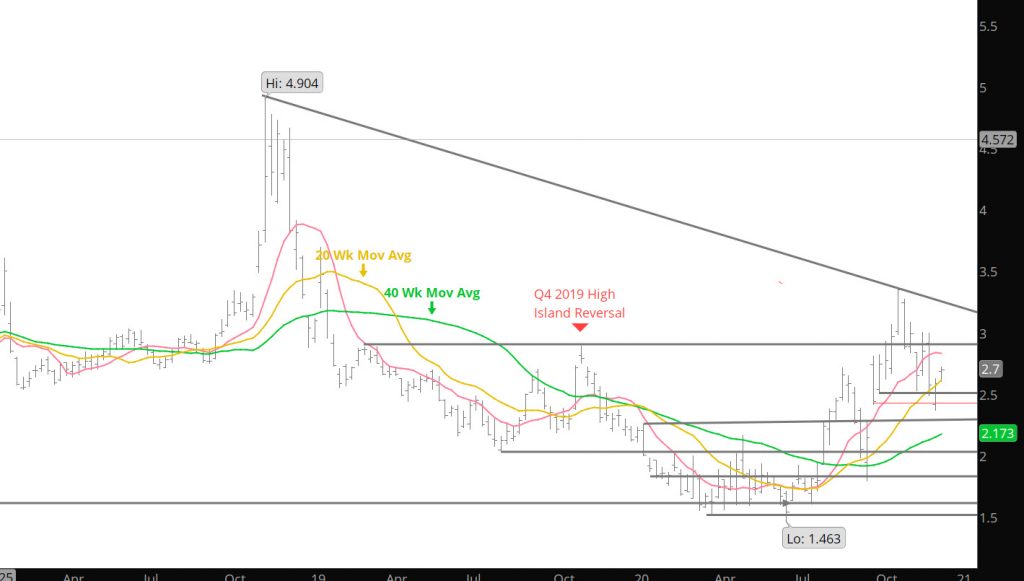
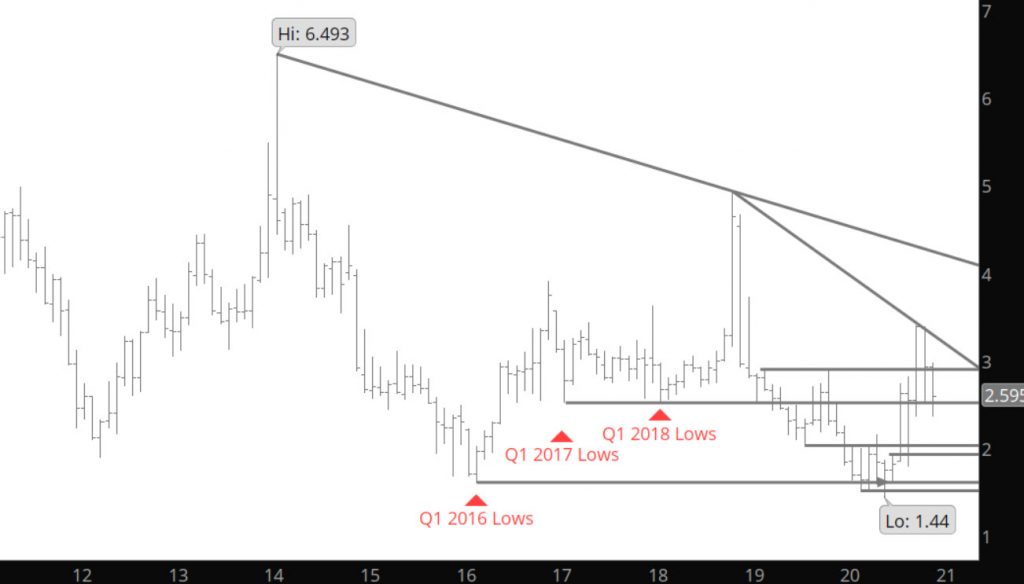
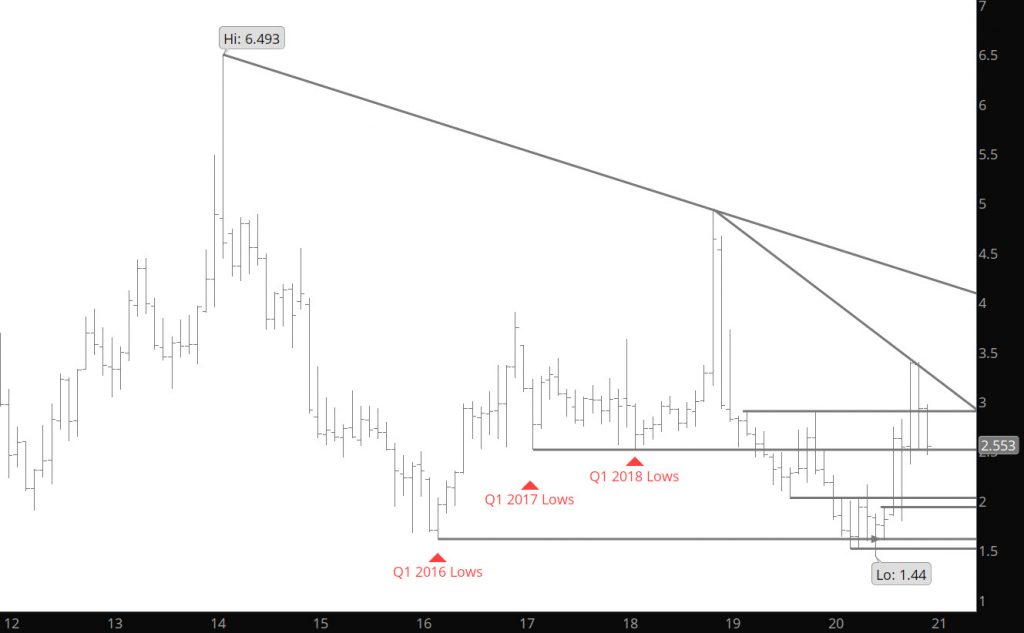
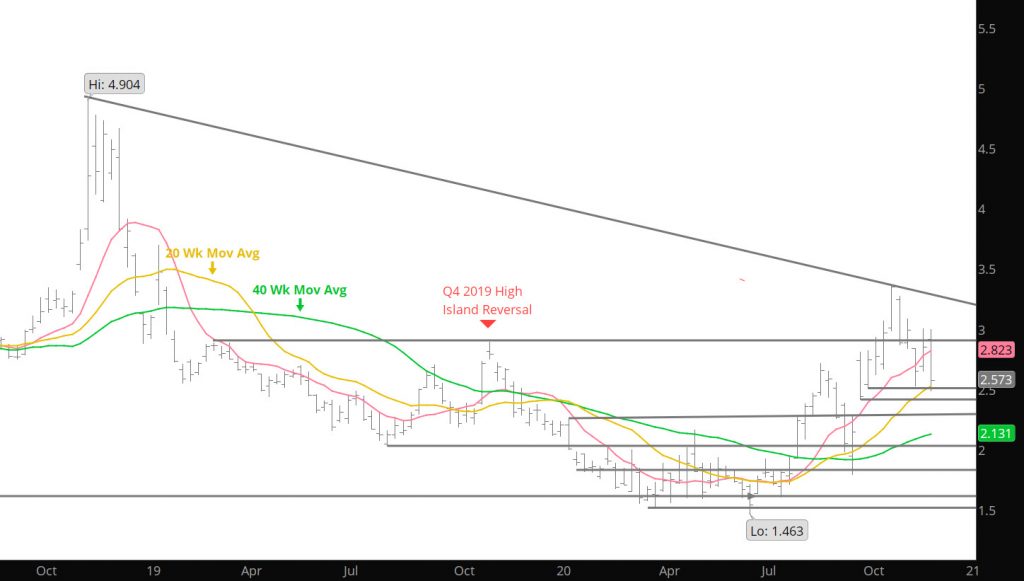
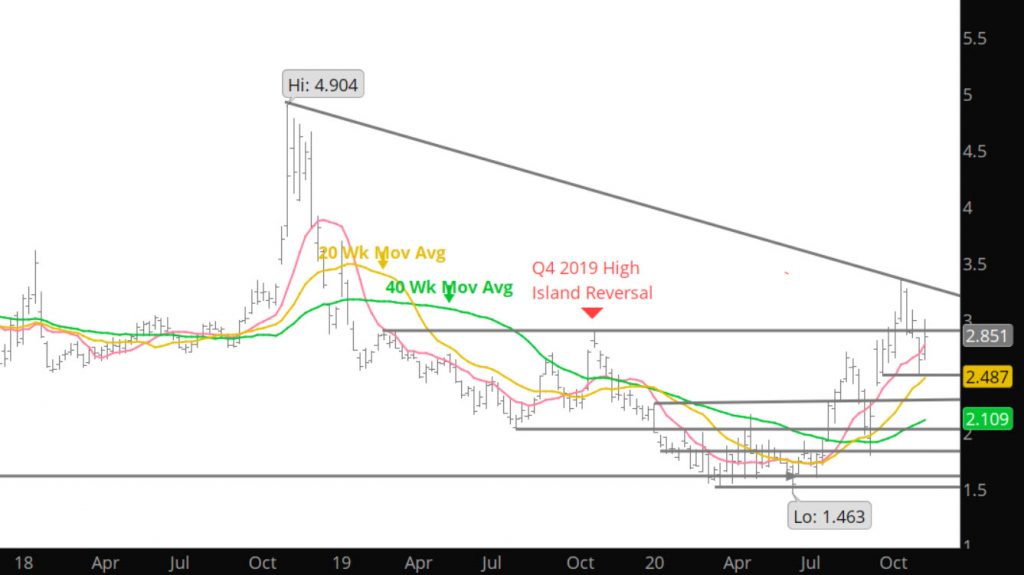
Clearly, the short / intermediated term market is defined itself as a bearish bias. Longer term the market has suggested that the bias is more neutral to bullish. Look at the chart below which represents the Daily Continuation of prices since the bearish bias developed starting with the declines in Nov ’18 after posting a high of $4.829.
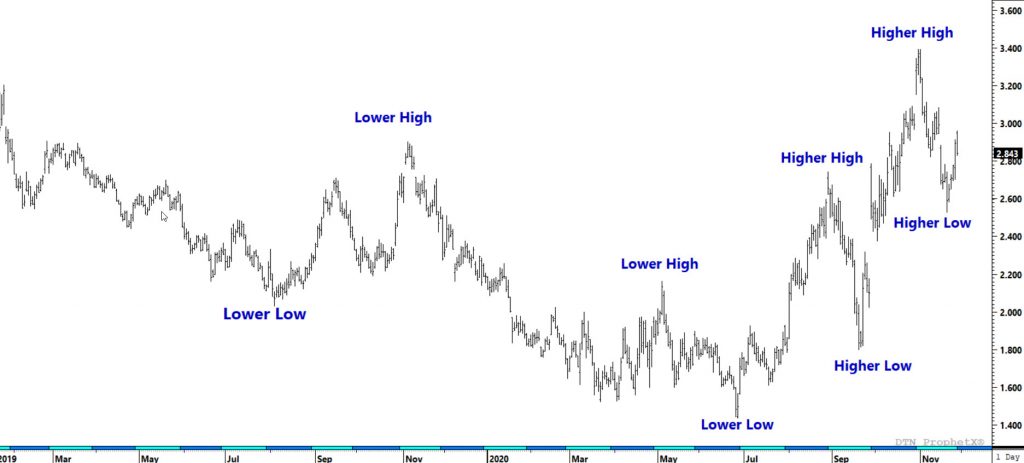
From those declines (for nearly two years) each rally was a lower high and ware met with a lower low. The exception was the brief rally in the fall of 2019 which had a lower high followed with a higher low. When the trend redeveloped immediately that exception should be considered a counter trend rally.
After the declines on the July expiration (low $1.432), the market has started to initiate a bias change, developing a series of higher highs and higher lows. The initial phase of this change occurred when prices were stronger during the annual weak September to trade above the May ’20 high and broke out from a trading range that had confined successive prompts since January ’20. That strength in August failed to break above the previous Nov high. From there the October contract fell nearly $1.00 before recovering to expire at $2.101. That recovery suggested that market had its first significant higher low since Sept ’18, beginning a bias change. That change would be confirmed with a higher high with the large premium afforded the Nov contract. Six consecutive higher weekly closes took prices above the Aug ’20 and the Nov ’19 highs. From there, the Nov contract settled above the Nov ’19 high and conclusively ending the negative bias.
The market is not going to take off from here but there is significant evidence that hedging strategies based upon the range of prices in 2019 and 2020 may be suspect.
Major Support: $2.61- $2.621, $2.425,$2.373
Minor Support:$2.785
Major Resistance:$2.82-$2.853, $2.887, $2.98-$3.05, $3.091, $3.151, $3.24,
Minor Resistance: