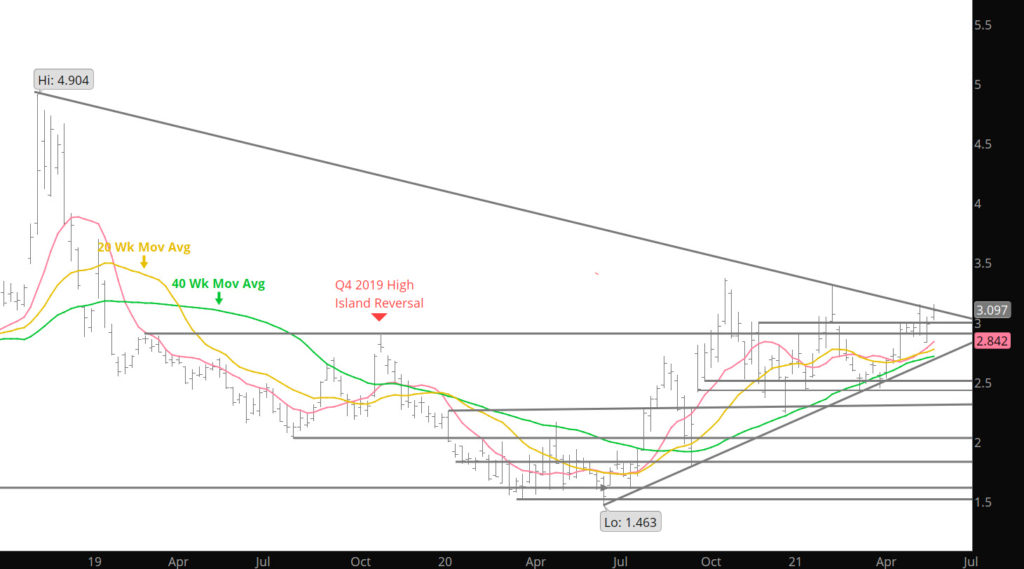
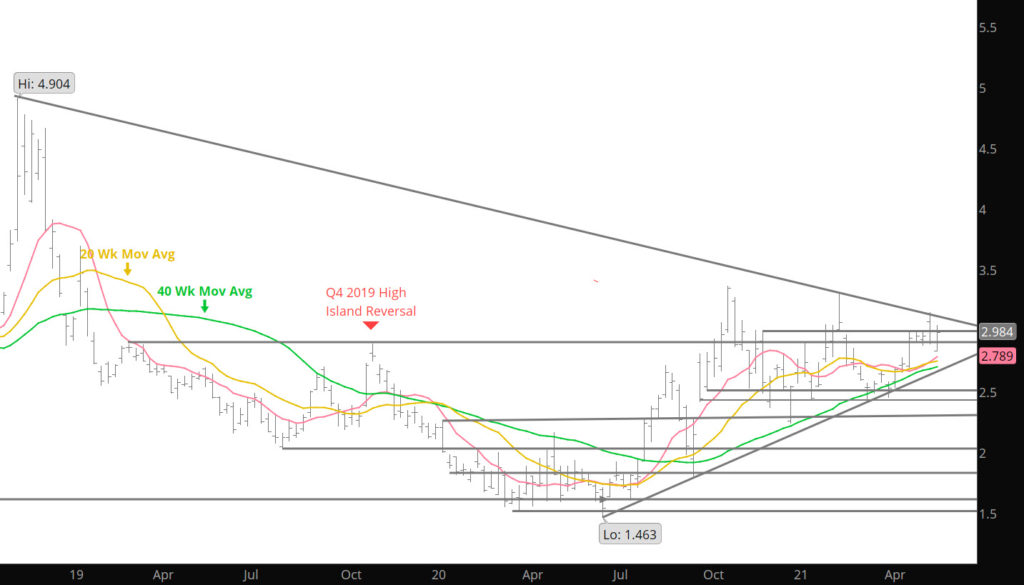
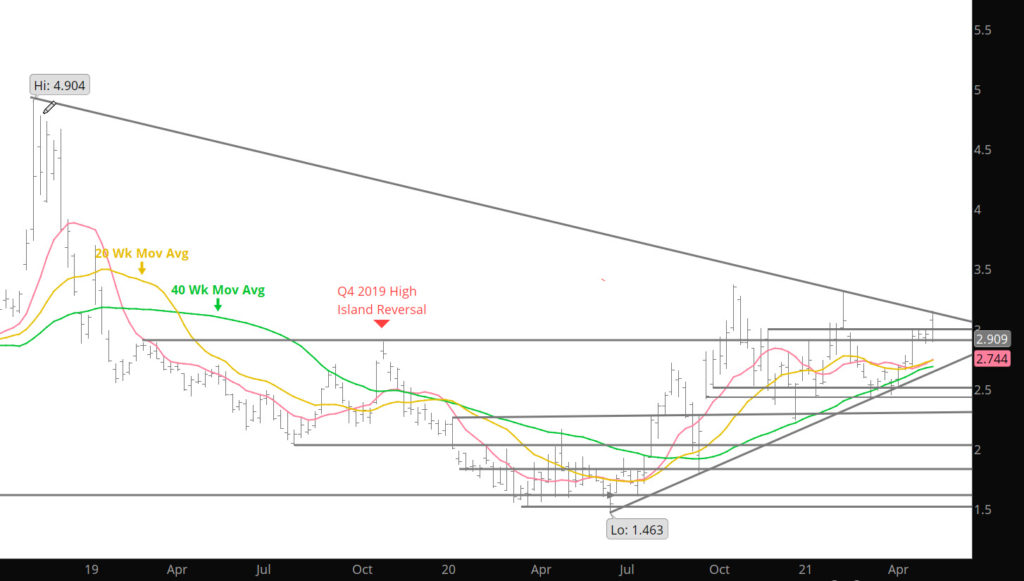
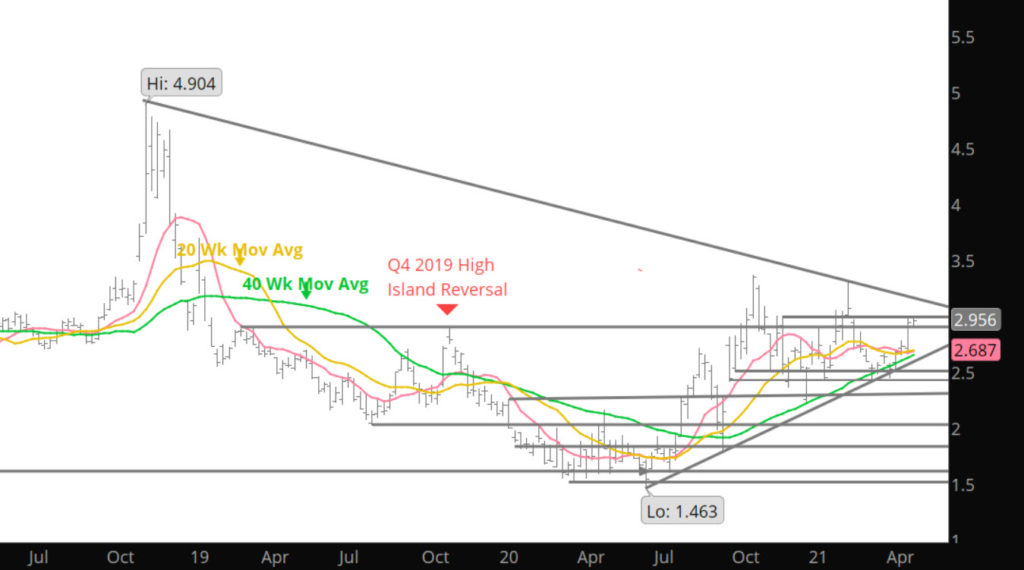
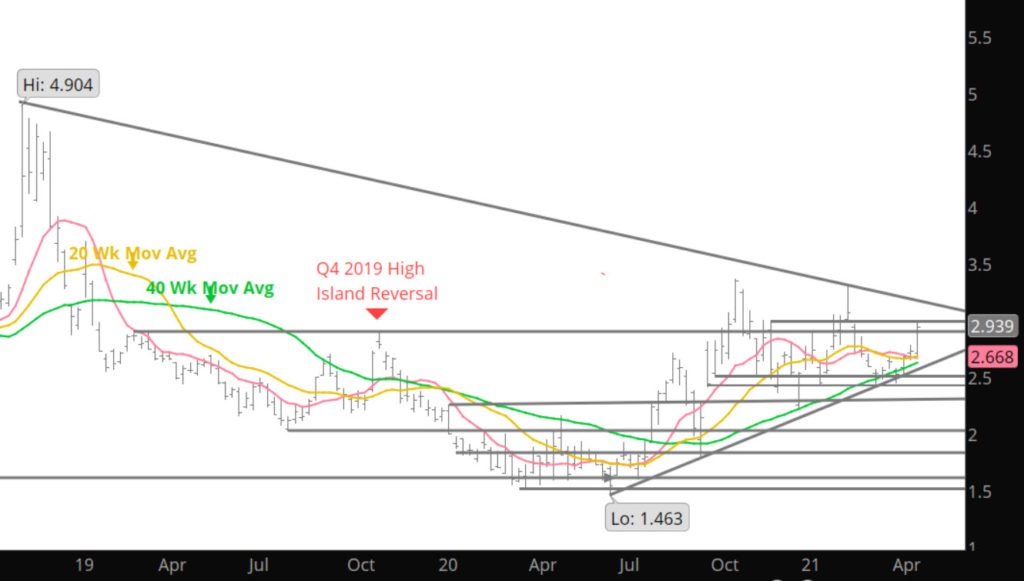
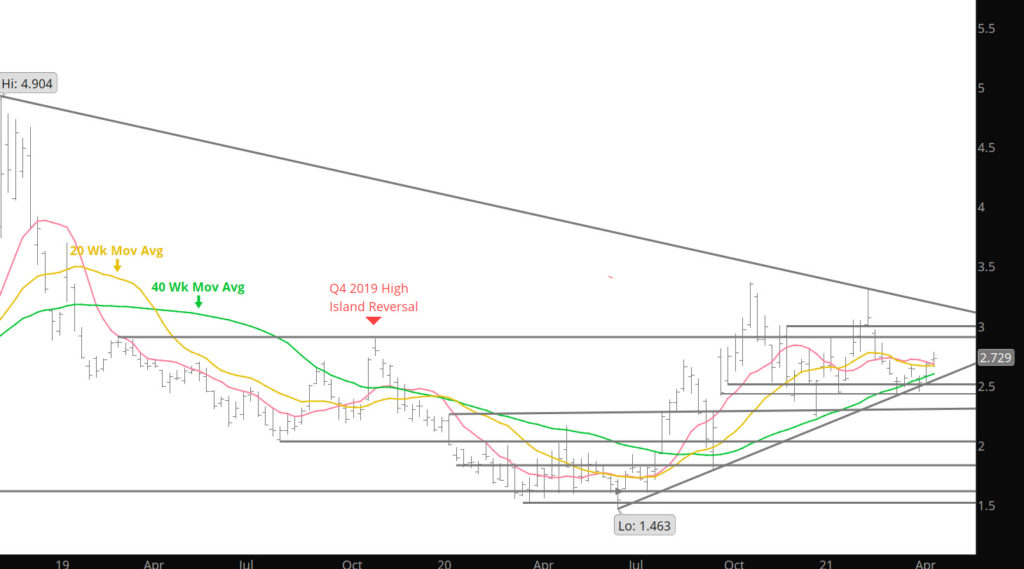
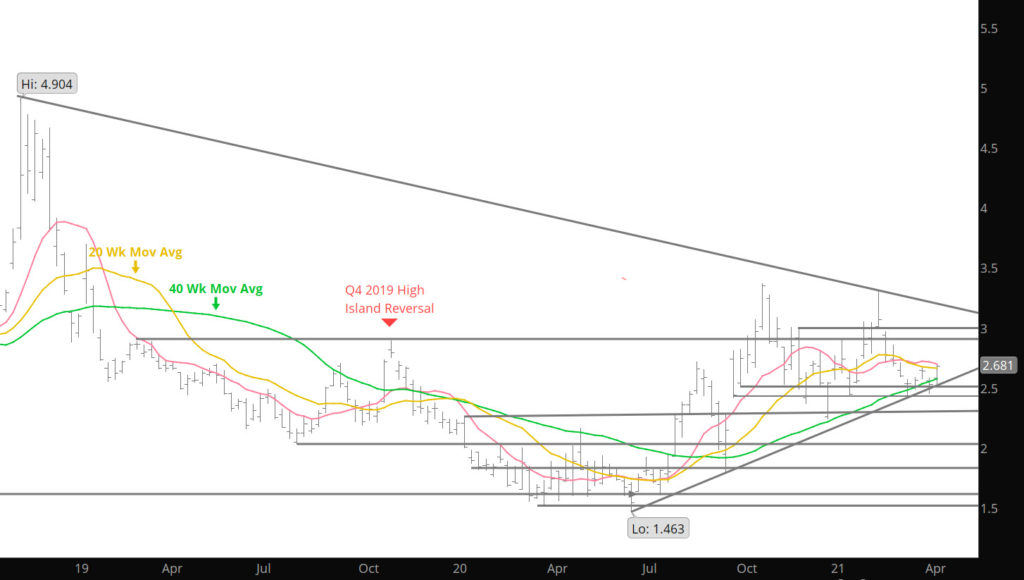
Discussed my thoughts that the high for Q2 may not be in last week and I do not consider the retest of the earlier high of $3.15 last week to fulfill my expectations. That said, last week’s close was the highest weekly close in the July contract suggesting strength coming into this coming week. We have seen this type of activity several times this spring where the week ends well bid or well offered only to see a reversal when it opens the following week. I am not convinced the $3.15 is the Q2 high and would prefer a retest of support, followed by a rally that defines the Q2 high.
Prices did close right on the downward sloping trend line off of the Nov ’19 high that forms the resistance area for the “wedge” discussed previously. Last week’s action occurred with higher volume and gaining open interest which are both confirming market internals to higher highs yet to come.
To read The Daily Call you must be a subscriber (Current members sign in here. )
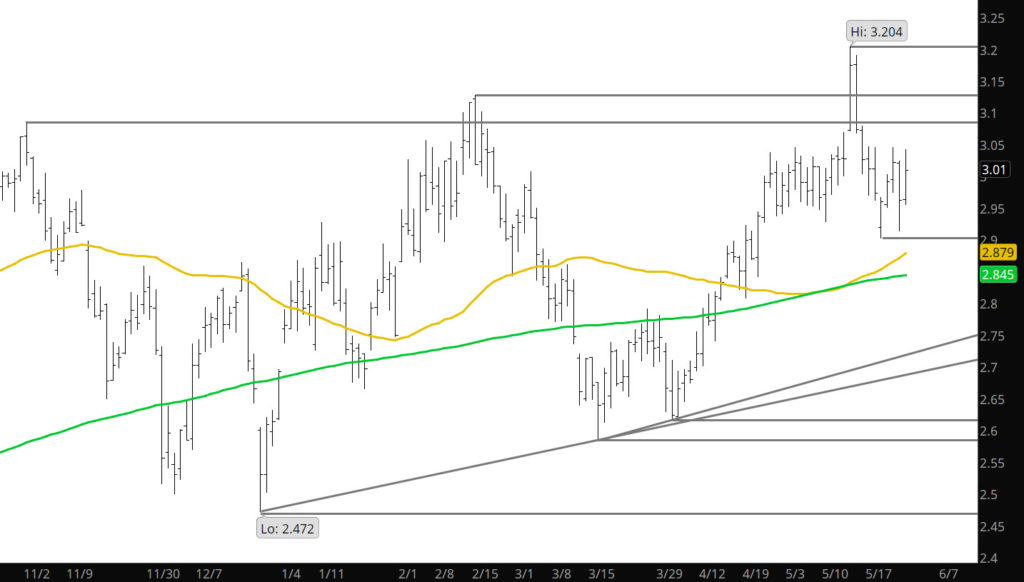
June opened the week with a gap lower on Sunday night only to reverse and close the gap — settling at the higher end of the range it had traded most of the month. Once June was off the board, July, which had followed June’s directional movements, gave up the expiration related gain, retreating to retest its gap lower opening. July had begun trading at 2.920, traded to 2.903 and then rallied to 3.046. Thursday’s low at 2.914 along with June’s pre – expiration low daily close (2.886) likely redefines the key support zone. The new prompt recovered again from that support in typical low volume pre – holiday trade to end calendar May at 2.986 after ending April at 2.978 (developing a theme here). All of the Q2 months have traded down to lower levels, but all were also well – bid into expiration. You may recall that last year those Q2 months were far from well-bid after trading earlier lows.
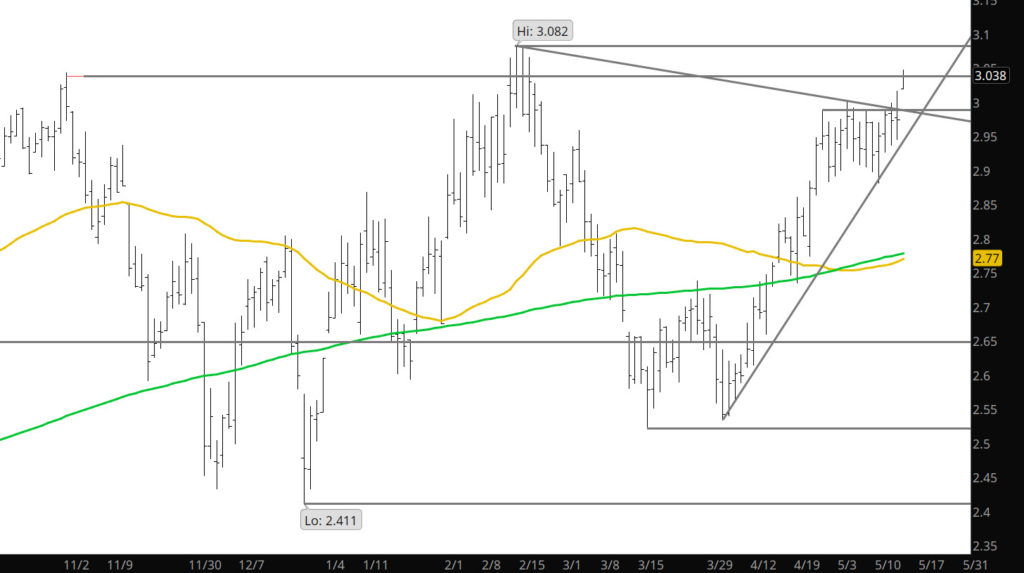
Spot July Contract
The interesting chart is the Spot July contract which shows a higher low after each rally since the low of July last July. Different from the Continuous chart above, the highs in July have continued to be higher than the previous high which is variant to the Continuous price action. While the highs attained last month ($3.15) fulfill the rally of Q2 over Q1 lows (average rally) I am not convinced that that will turn out to be the final Q2 high. The prompt chart suggests that July has not finished its run.
To read The Daily Call you must be a subscriber (Current members sign in here. )
Many of you commented last week that the price action reminded you of Feb ’21 when the market rallied (primarily on short covering) only to reverse by the end of the week forming a distinct bearish weekly reversal. Great observations– while the Feb rally to prices just short of the early Nov ’20 highs, last weeks rally stopped on the declining trend line of resistance (Nov ’19 highs and the Feb ’21 high). The reversal was quite sudden (similar to Feb) and left a bearish reversal.
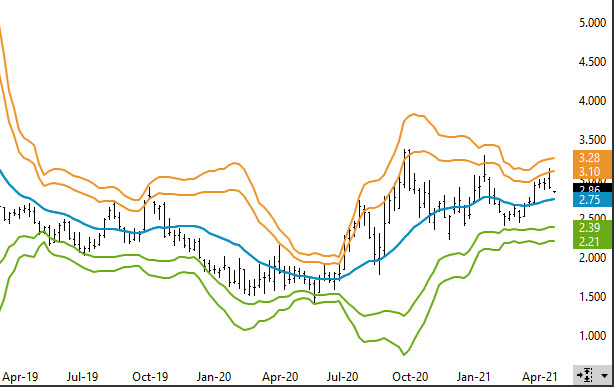
Weekly Continuous with Bollinger Bands
The failure at the trend line was also confirmed by the failure at two standard deviations over the 20 Week SMA in both the Feb run and last weeks. All of this occurred on gaining volume and open interest- not supportive of large future gains in the immediate future.
To read The Daily Call you must be a subscriber (Current members sign in here. )
Last week provided a brief break above the key $3.00 resistance area, only to find the sellers that have appeared on previous tests, which sent prices back to the middle of the previous range the Jun contract has provided us. The run did send prices to the highest price for a prompt contract since February 22nd. The close last week did not provide a closing break above the declining trend line from the Feb highs, but early trade on Sunday night has broken the aforementioned trend line.
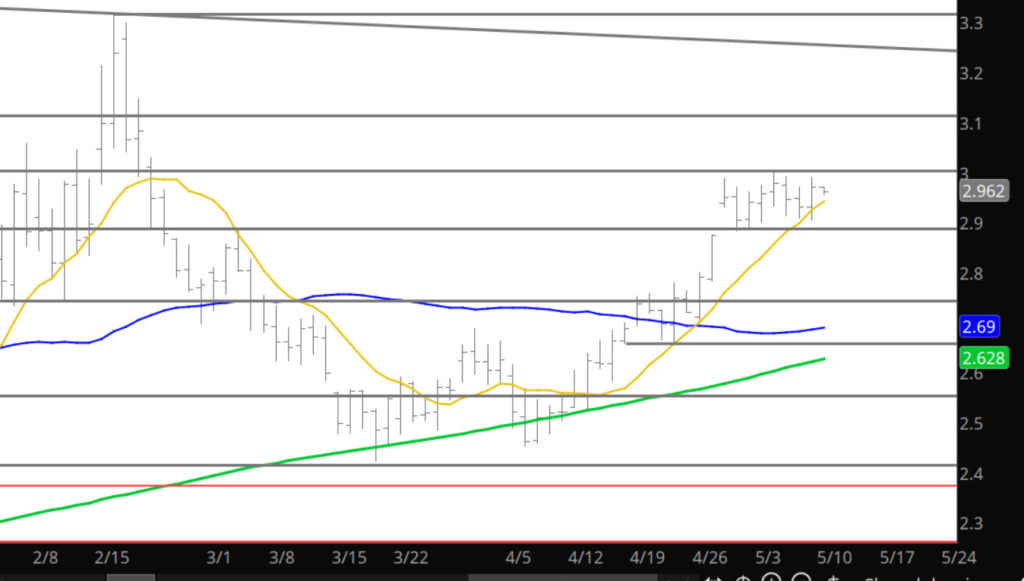
Spot June Contract
Last I mentioned the upside momentum that June built coming off the April low(gains of .149, .064 and .113 in three of the weeks). Last week, momentum seemed to be exhausted with a fourth straight gain of only .027 and those gains were associated with slightly lower volume (week over week). Consolidation (.$30 gain) may be occurring in the June contract but I would of expected significantly lower volumes under that scenario.
To read The Daily Call you must be a subscriber (Current members sign in here. )
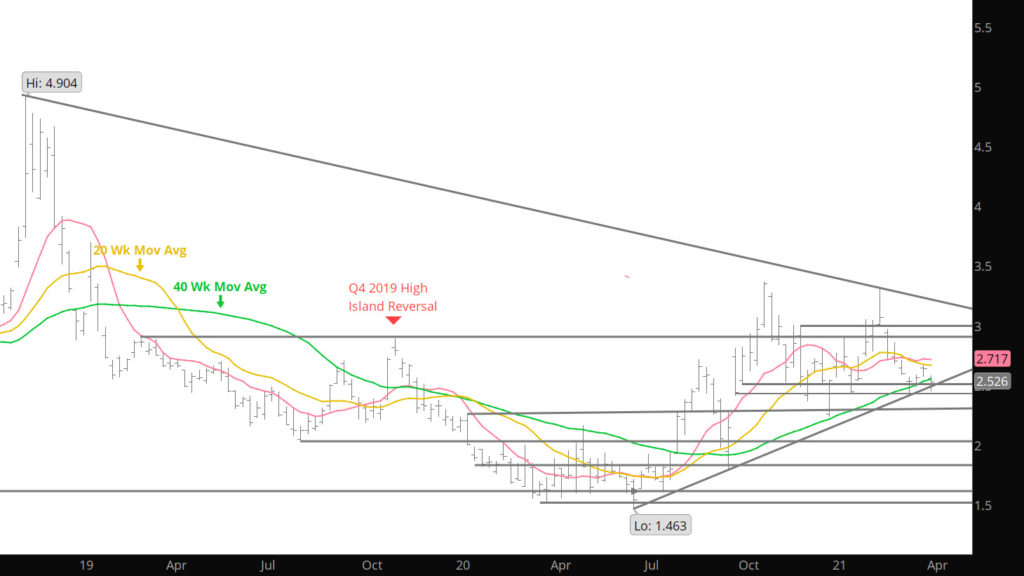
Last week continued the consolidation process in a fairly tight range. It may turn out that the prompt June extends the rally toward the upper boundary of the developing triangle ( trend line declining from the October – November and February highs, the current value of which is 3.256 in the Daily Chart above). There is historical precedent for June extending the rally later during its tenure as prompt. In ’19 the high of June’s tenure as prompt didn’t trade until 05/20, in ’18 June’s high traded coincident with expiration. From a historical stand point — since 2007 prompt June has traded through the calendar April high in 12 of 14 years (the only exceptions were ’14 and ’19) . The first trading day of May this year made it 13 of 15.
To read The Daily Call you must be a subscriber (Current members sign in here. )
Prices were well supported last week during the expiration process and with the first couple of days for the June contract as prompt. The action led to a higher weekly close for six of the last seven weeks. That just leads to confirmation of the recent bullish bias trend that has permeated the nat gas market of recent weeks with little or no fundamental reasons (at least the fundamental traders haven’t highlighted any to me recently).
Market internals show last week’s volume basically flat to the previous week and both of the last two week’s volume down from earlier in April. For an extension of the rally beyond $3.00, the bulls would like to have volume increasing as prices have gained in the last two weeks. Momentum indications (Daily and Weekly RSI being lagging indicators) are reaching the higher side of the range but are not over-bought. The weekly Bollinger band analysis also confirms that the trade is likely near the top end of the new range but prices could work another dime higher before signalling potential issues.
To read The Daily Call you must be a subscriber (Current members sign in here. )
Last week prices trade through the resistance that limited the upper boundary of the recent short term trade and closed above it. While this type of event usually has supportive technical implications, the market internals (volume and open interest) did not, but it should be noted that the daily outside reversal on Thursday did occur on above average volume. This is all very short term interpretations and doe not alter the medium and longer term analysis that this web site has provided over the last few week. It is not uncommon for prompt gas to return to test the validity of “new” support (or resistance) once violated becomes support. Perhaps we will witness that type of action this week as the market heads into expiration.
Several positive technical aspects occurred in last week’s trade–prompt gas closed above the upper boundary of the recent range that has held action with the highest weekly continuation close since late Feb (2.854) and above the 10 Week SMA for the first time since that same week. Unfortunately, the second straight weekly gain came with decreased volume (this week average daily volume fell by an roughly 15,000 contracts while total open interest fell for the third straight week. Look at the chart below:
To read The Daily Call you must be a subscriber (Current members sign in here. )
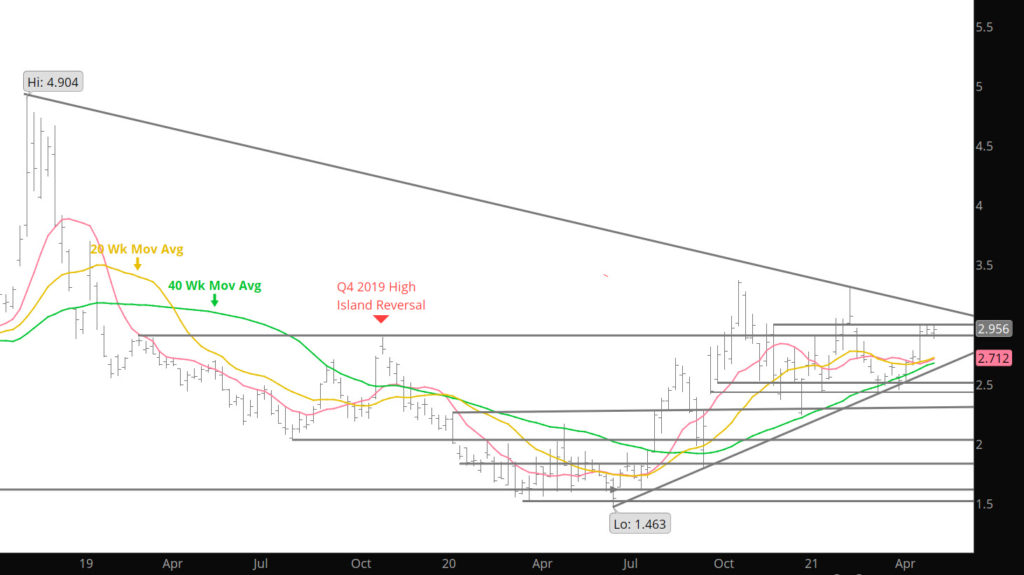
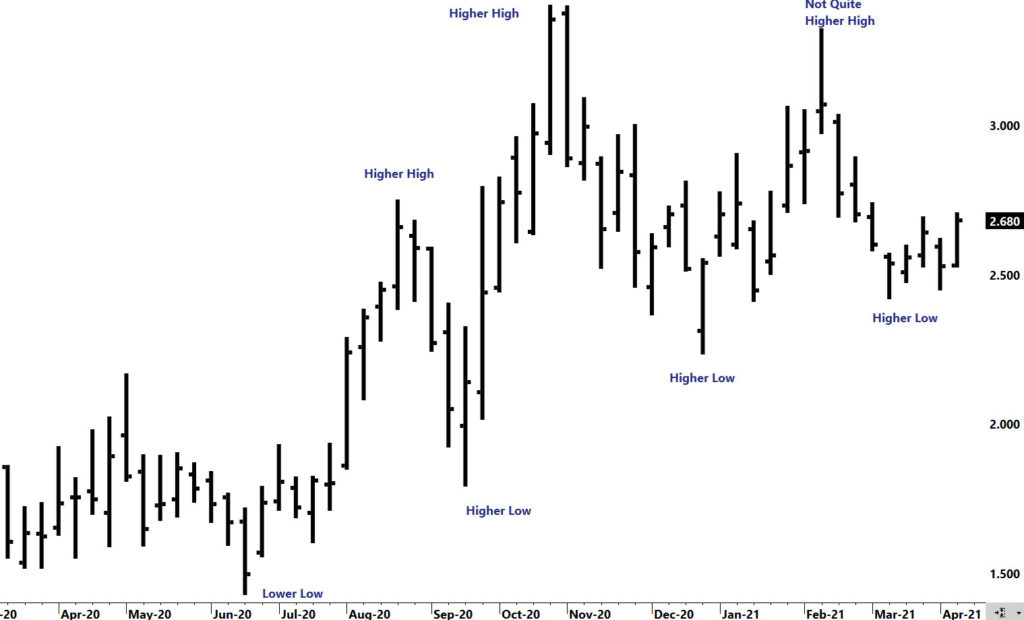
As many of you know already– commodity markets have been on a tear for 2021, many since last July. Copper, gold (though not of late), corn, soybeans the list goes on. Many pundits have referred to as a super-cycle in the commodity trade. Yet with all this bullishness, gas has not been able to hold onto the gains made late last year and have constantly retraced. Grant you prices are higher this year but it does not seem as strong as most of the other commodities. This website has discussed several times last fall and winter the “bias change” that was occurring in the gas market and with all the discussion about the super-cycle, it is time to update the charts.
Weekly Continuations with Highs and Lows
Notice in the charts, the multi-year low late last June (interesting timing with the commencement of the other commodity rallies), the market has set a series of higher highs and higher lows. The one exception was this February when prices could not exceed the previous high from Nov by a few pennies. Other than that– the gas market has maintained a significant premium to the June ’20 lows. This activity may represent the development of a more bullish environment for gas in 2021.
To read The Daily Call you must be a subscriber (Current members sign in here. )
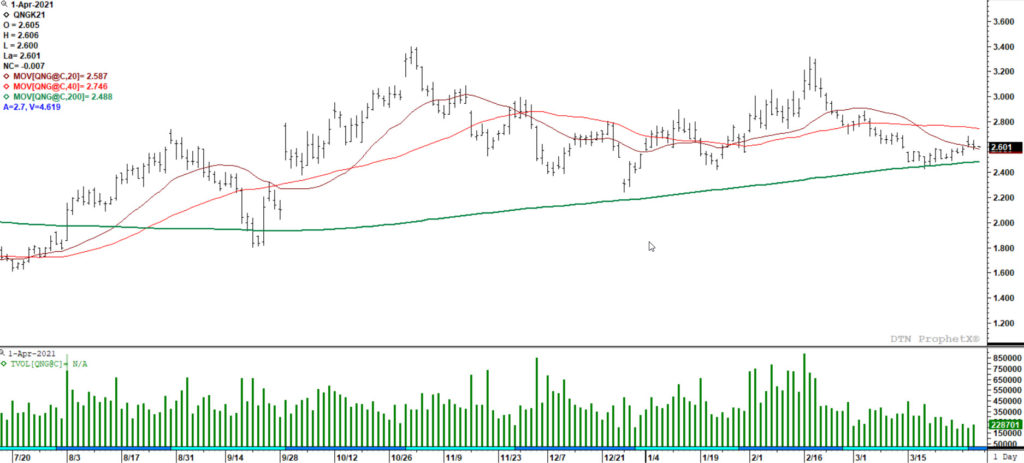
Spoke in Good Friday analysis about the declining volatility that the current market had been maintaining. Nothing changed last week as the prices remained in a tight range environment, seemingly going nowhere. Maintaining above the 200 day moving average but closing just below the 40 Week Moving Average, prices seem to want to test the low end of the current range $2.45-$2.42 and very well may but the key is what happens upon that test — a break below will likely bring the lows from last Dec into play a test and failure will send a much different signal.
Going back to the volatility and lack of it in the current market and the potential impacts for future prices. Look at the chart below, it represents the continuous price movement (upper pane) and the daily range for prices over the last 14 days (lower pane):
To read The Daily Call you must be a subscriber (Current members sign in here. )
History shows that more often than not seasonal lows trade with declining volume. Volume on Sept 22nd was substantially less than the volume of the day before or day after. The retest of the late Dec low (also a relatively lower volume day) on January 22nd when the January low was traded at 2.414. The technical indication is that whatever downside momentum that was carrying prompt gas to that low, was or was about to be exhausted. Another way of analyzing this the sellers were running out of participation to drive the bid lower. Perhaps, a variation of that pattern is going on right now. A week ago, April gaped lower on Monday, traded quietly in a range for a couple of days then spiked down toward a test of the January low. Interestingly, the volume on 03/18 exceeded that of 01/22 by more than 100,000 contracts, suggesting that there may be enough additional selling (discussed here) to challenge the conventional and moving average support (the 200 day SMA was 2.447) and leave prompt gas below the trend defining 40 week SMA. Since that spike lower with 415,730 contracts traded the market has preformed an “outside” day reversal to the upside (March 24th). Average daily volume for week ending Mar 26th declined an estimated 80,000 contracts from a week earlier and was the lowest since the holiday shortened Christmas week. Perhaps there is additional selling waiting, but last week’s expiration suggests that volume has sufficiently dried up to indicate that there has been a successful test of the January low during March, looking like an intermediate term low with of the construction of the lower boundary of a trading range.
Some additional support for that view can be found in the change in open interest. The last three meaningful increases in the total number of contracts outstanding were on 03/12 (when selling continued into the weekly close, suggesting lower prices were in store when trading resumed discussed here), 03/15-when prices began the next week with a gap lower, and on 03/18-when April tested the 200 day SMA and January low. Those increases indicated that short sellers were throwing increasing positions significantly, attempting to drive it lower. These actions proved successful the first two times. April fell from a high of 2.714 on 03/11 to that 2.422 on 03/18. Since the 03/18 low open interest has declined each day indicating that gains have been significantly attributable to profit taking (the rally around expiration can also support this view) and does suggest that weakness should be bought near term.
To read The Daily Call you must be a subscriber (Current members sign in here. )