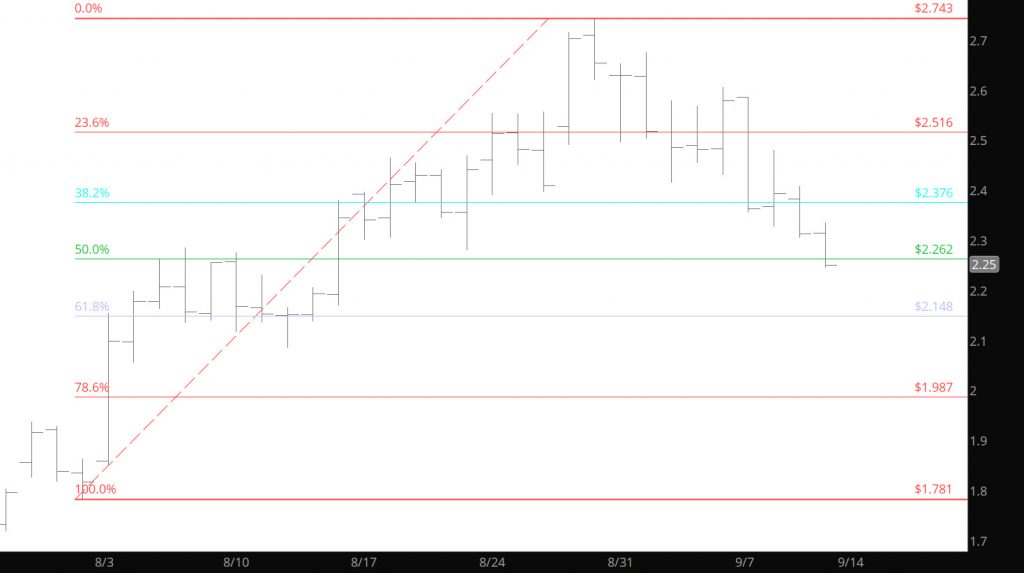
Suggesting for the last couple of weeks, that prices need to retrace the gains since the beginning of August. The last two weeks have eliminated the over bought status driven by the momentum indicators. The Fibonacci retracement went just down to the 50% support zone (from the lows in late July to the highs last week) see Chart below.
Fibonacci Analysis from late July Lows to Recent Highs
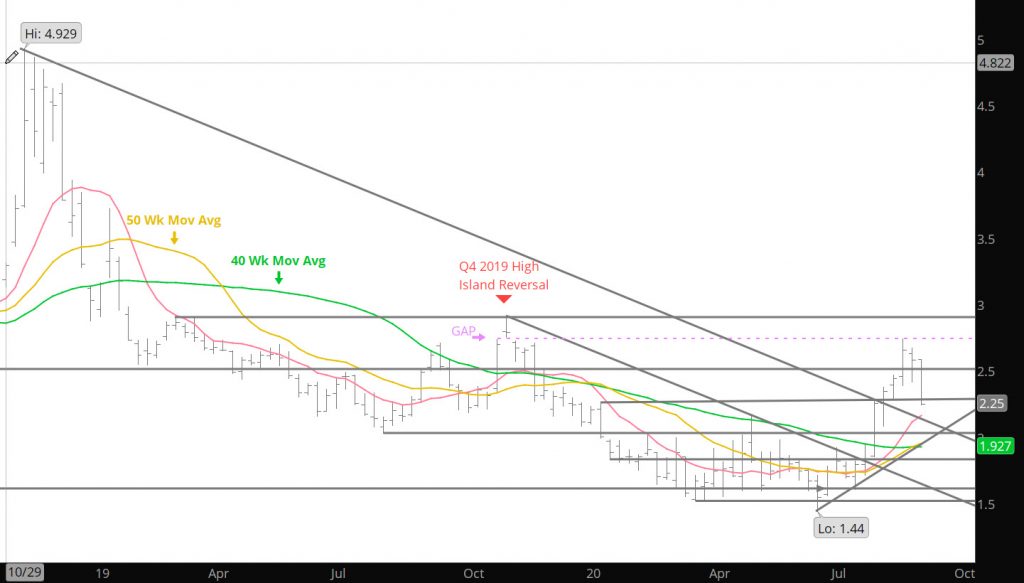
The declines are in-line with the the historical averages for declines from either side of the holiday. Now, the market will need to wade through the sentiment associated with the late year rally (occasionally concurrent with forecasts). Heard some whining during August, from many folks arguing against the well bid market when storage inventories are clearly going to be over 4 TCF. This is a fundamental concept that I ignore, but I remembered a few years ago when they ended over this level so I thought I would go back and look at what happened to prices. In 2016, prices rallied strong in October to correct some of the gains in early November then was well bid well into the winter. In 2015, after coming off declines most of the summer and fall— prices collapsed with a slight rally early in Dec. before resuming the declines, setting the stage for a multi-year low in March ’16. So there are two potential outcomes regardless of ending at 4 TCF, looking at history– yet another example of the value of technical analysis.