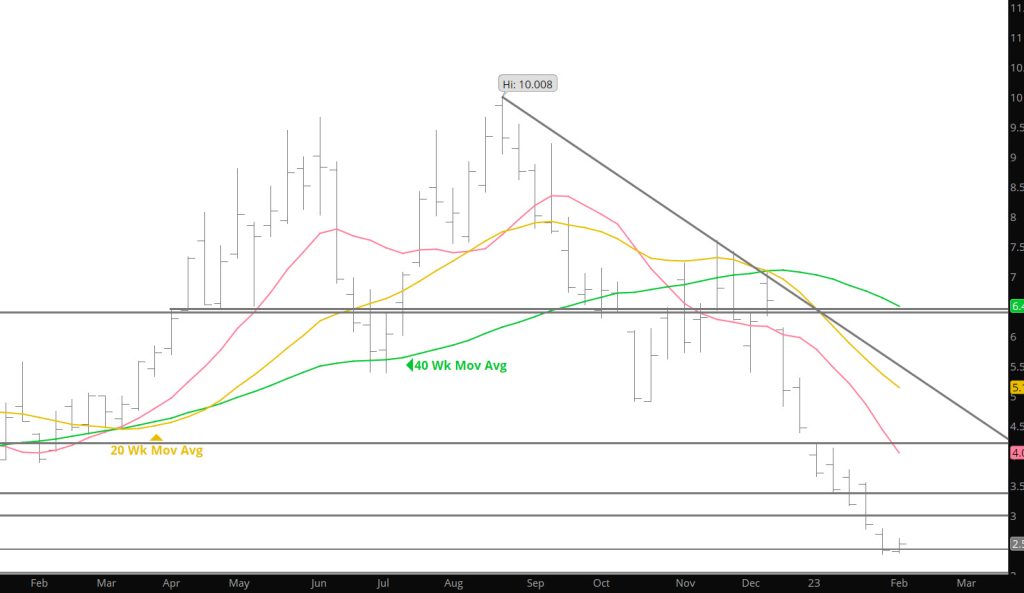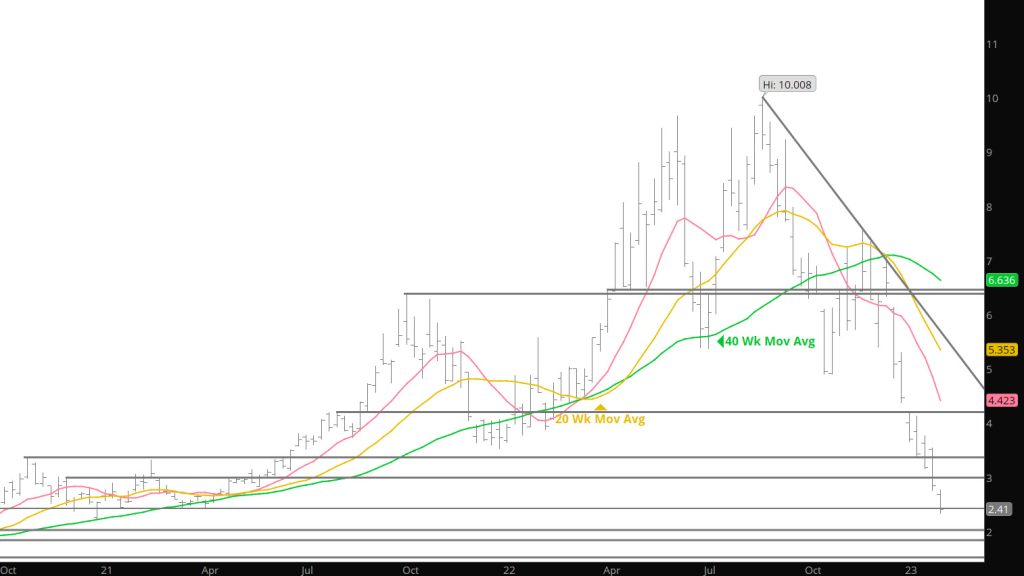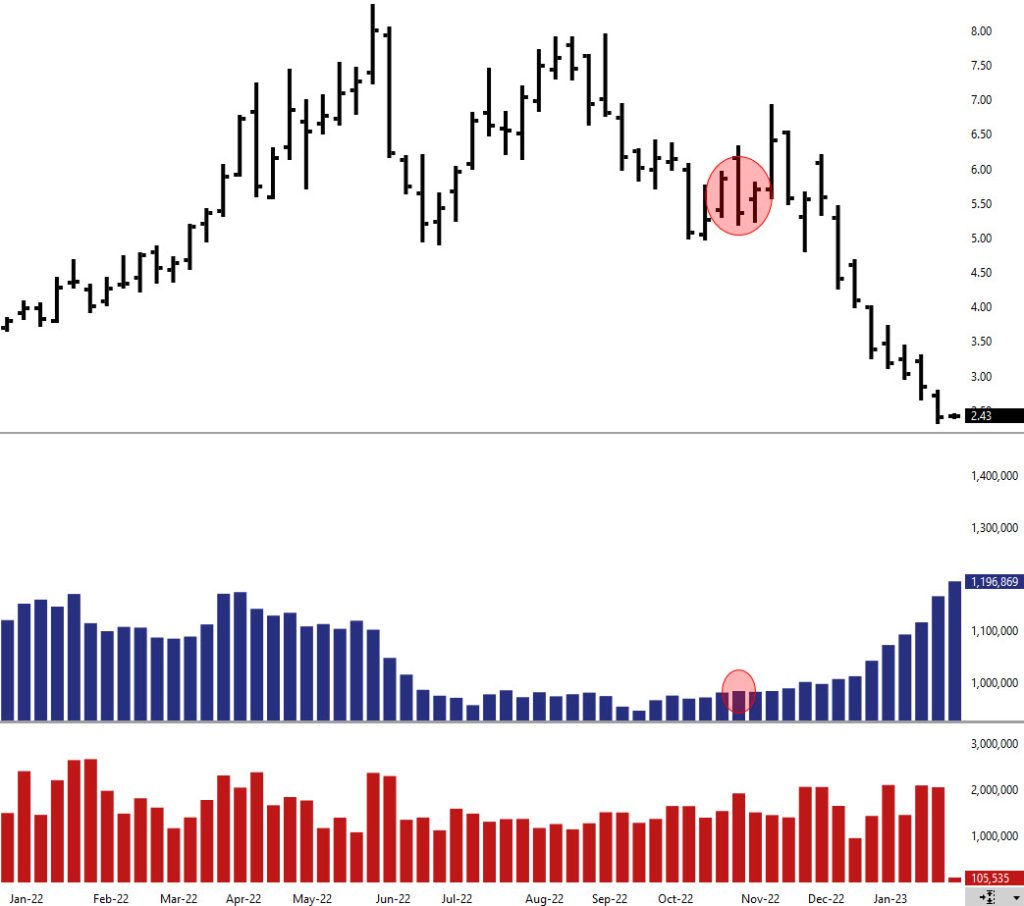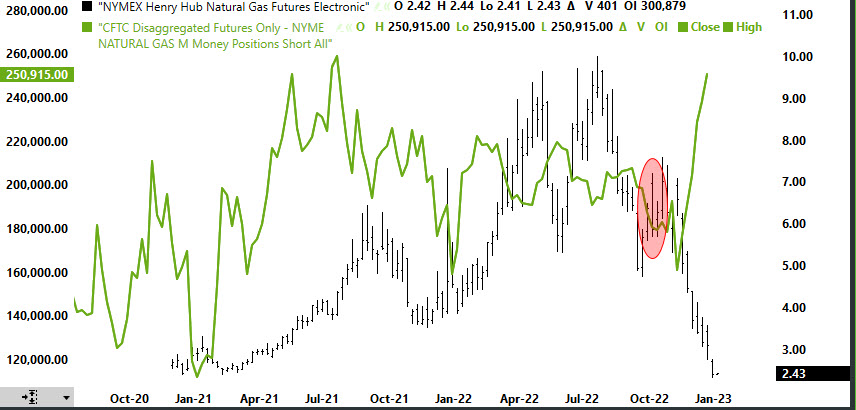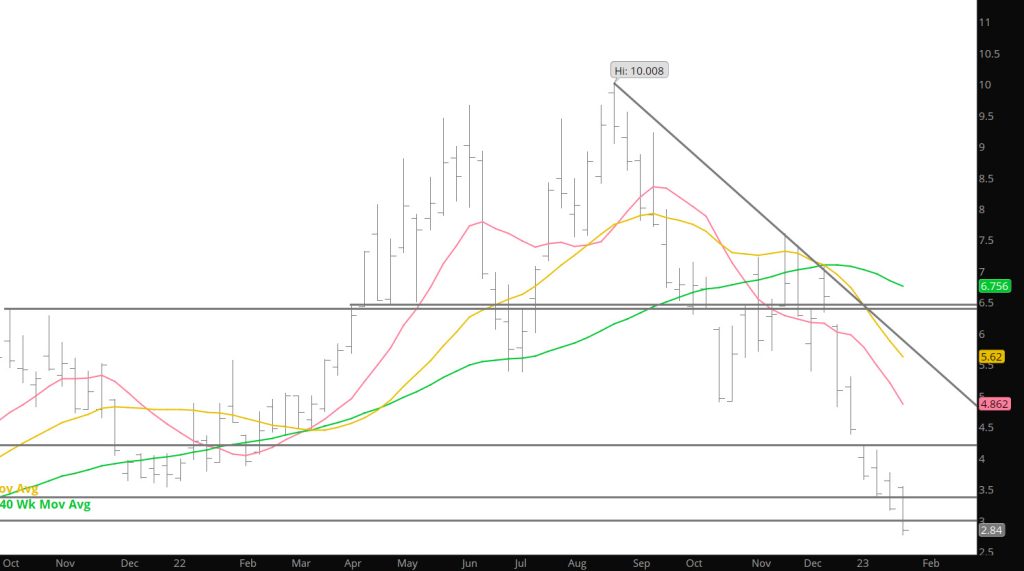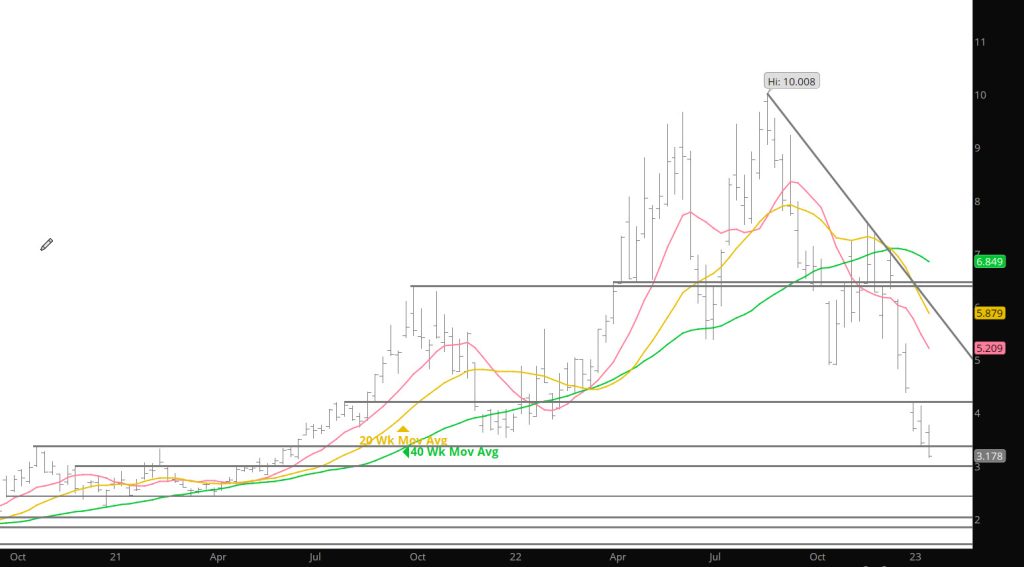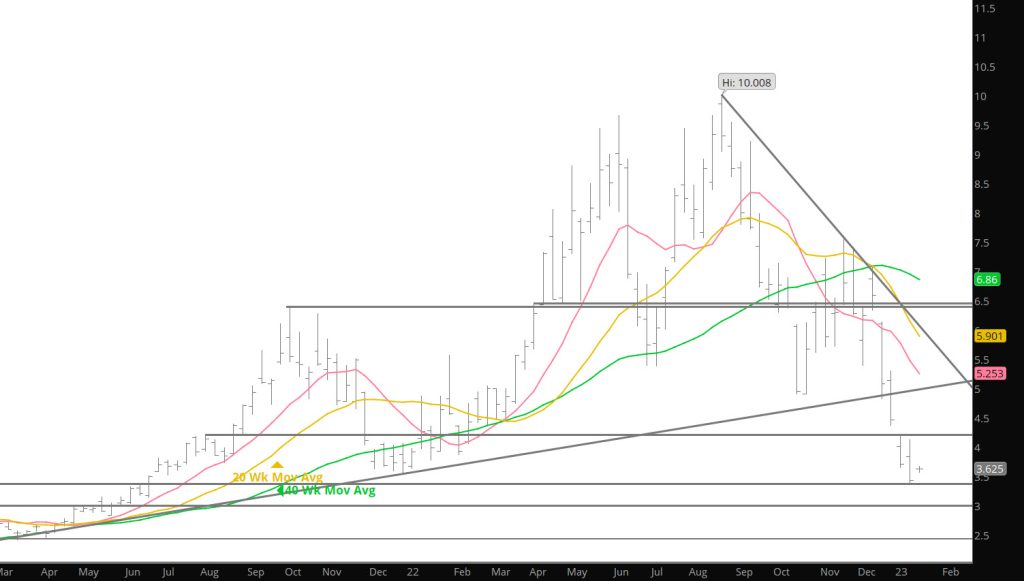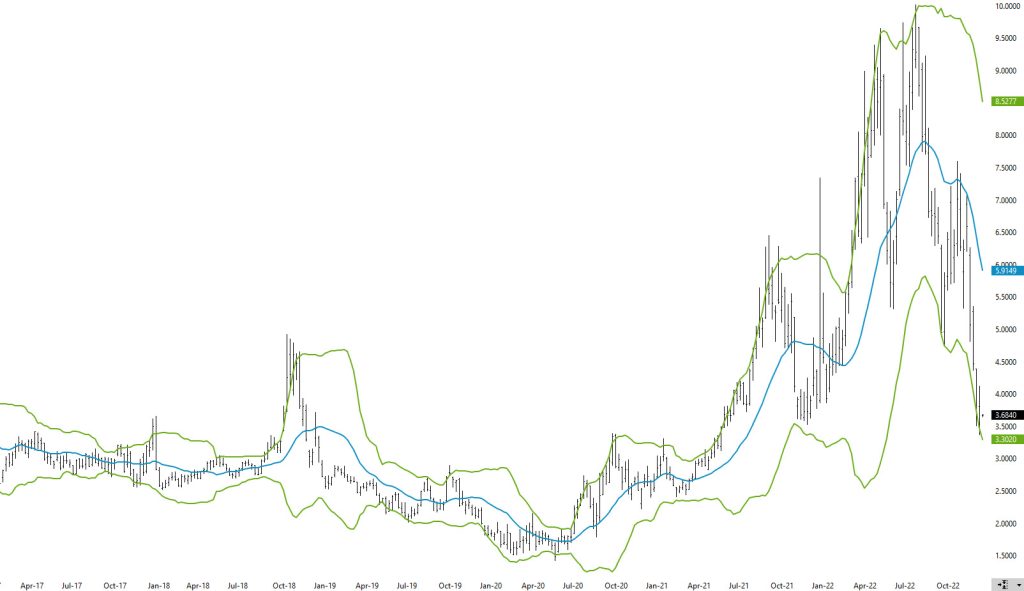
Declines Break Testing Two Year Support

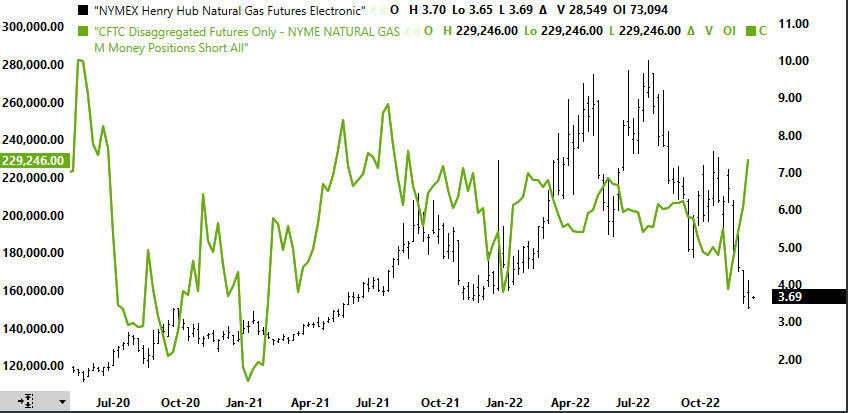
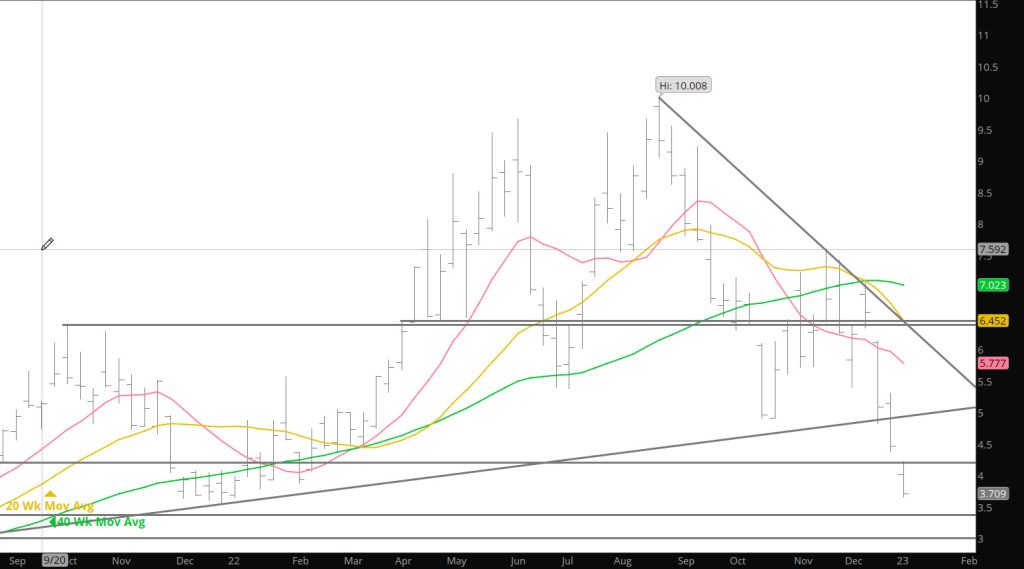
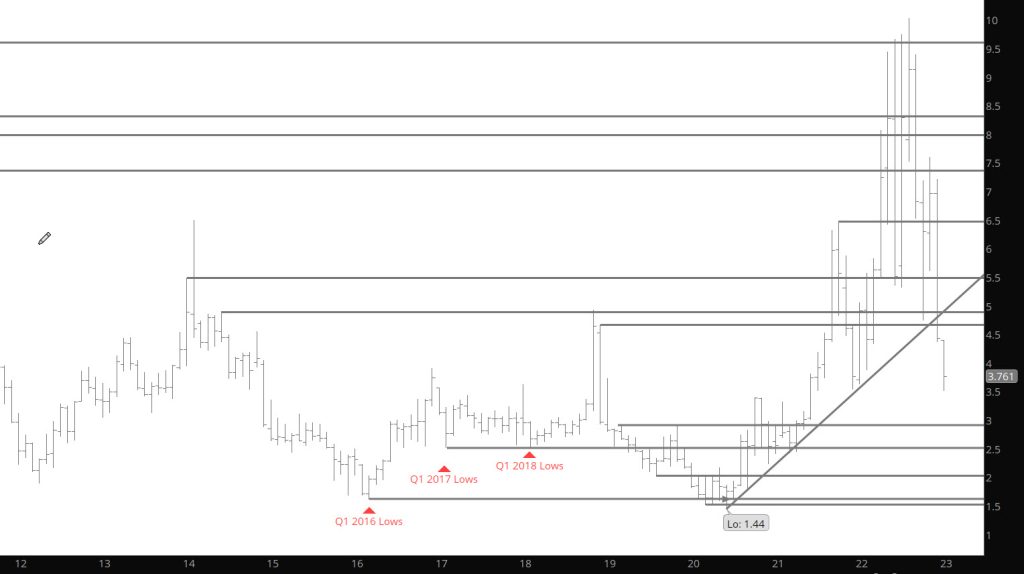
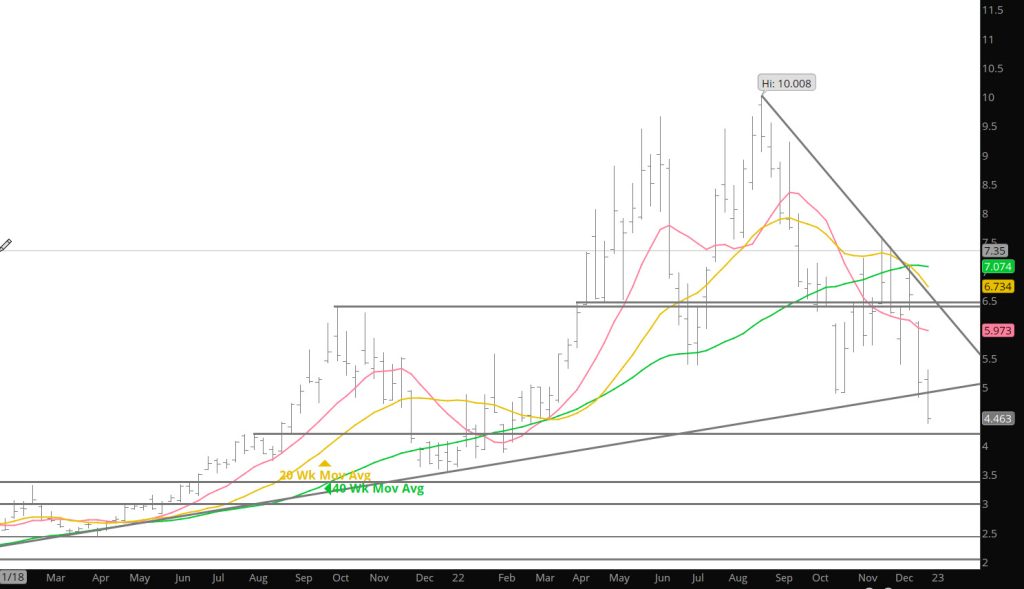
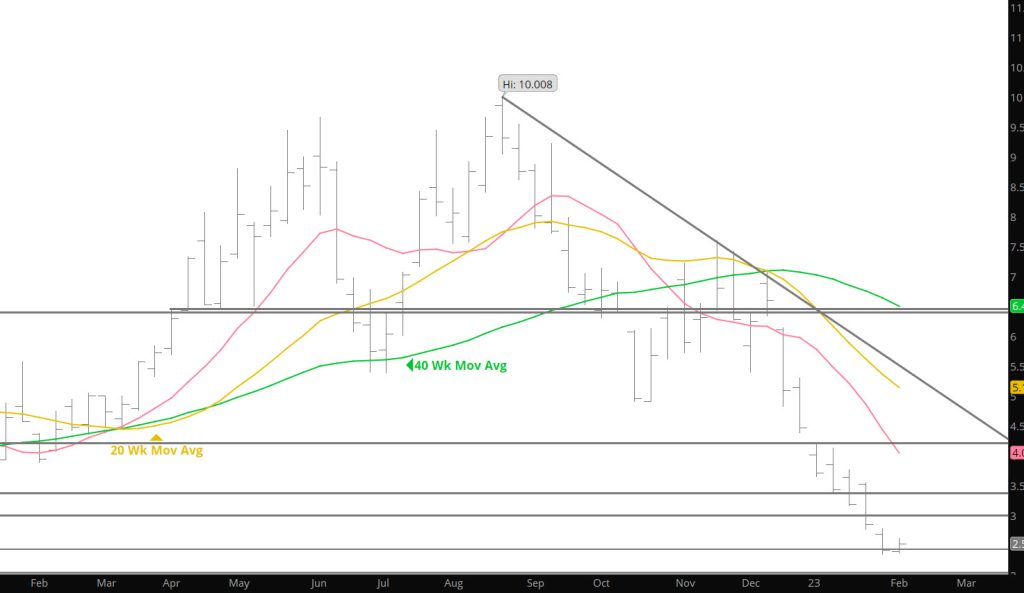
The warming weather trends last week took prices down to test levels of support that have not occurred since a year ago. As discussed last week the market has a tendency to develop a key level around the 1st of January.

…late December/early January highs or lows have consistently been disproportionately important going forward into each new year.

To read The Daily Call you must be a subscriber (Current members sign in here. ) Start your subscription today.

Big Gap Open Only to Fail

Weekly Continuous

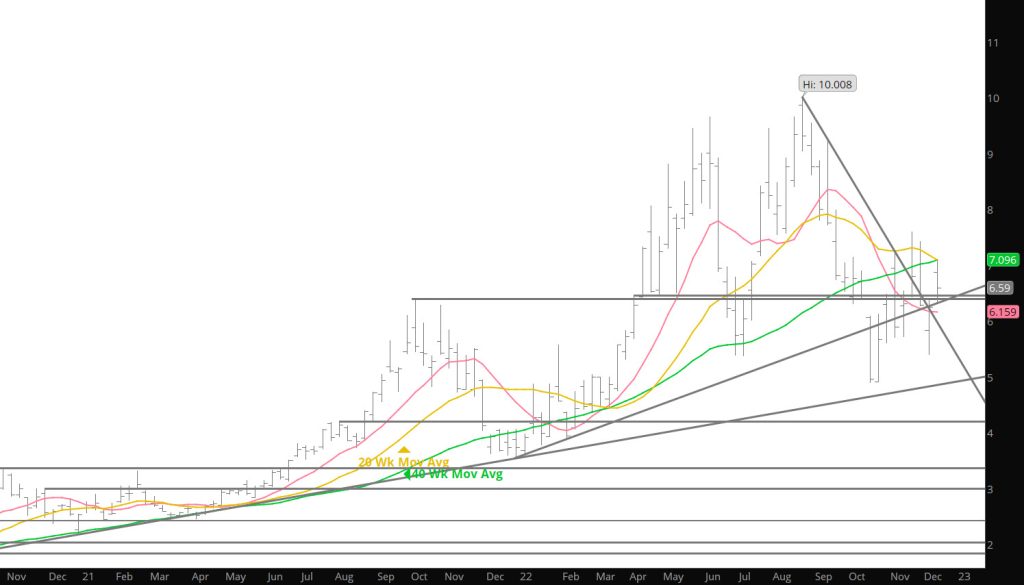
Follow through buying took the prompt to $7.058 before a reversal lower. Another one on Tuesday in the opposite direction set the week’s high at $7.105 testing the resistance from the intersection of the 20 – week SMA and the still rising 40 – week SMA. From those levels, prices immediately retraced and closed the gap from Monday and closed the week in the middle of the range.

The results left prompt January $.355 higher, but examination of individual monthly gains in the winter prices, showed an interesting divergence. Weekly gains of February were over $.20 except for March. Sandwiched between February’s + $.221 and April’s +$.229 was March at +$.037. Chances are (guesses really) are that difference was a result of substantial buying of January and February while simultaneously selling March– sometimes referred to as a near – term bull spread. Building length in the remaining winter while offsetting that length in March. With strong volume in that spreading would indicate that folks are expecting additional winter strength in early 2023.

To read The Daily Call you must be a subscriber (Current members sign in here. ) Start your subscription today.

After Gap Down, Prices Recover During Week

Weekly Continuation

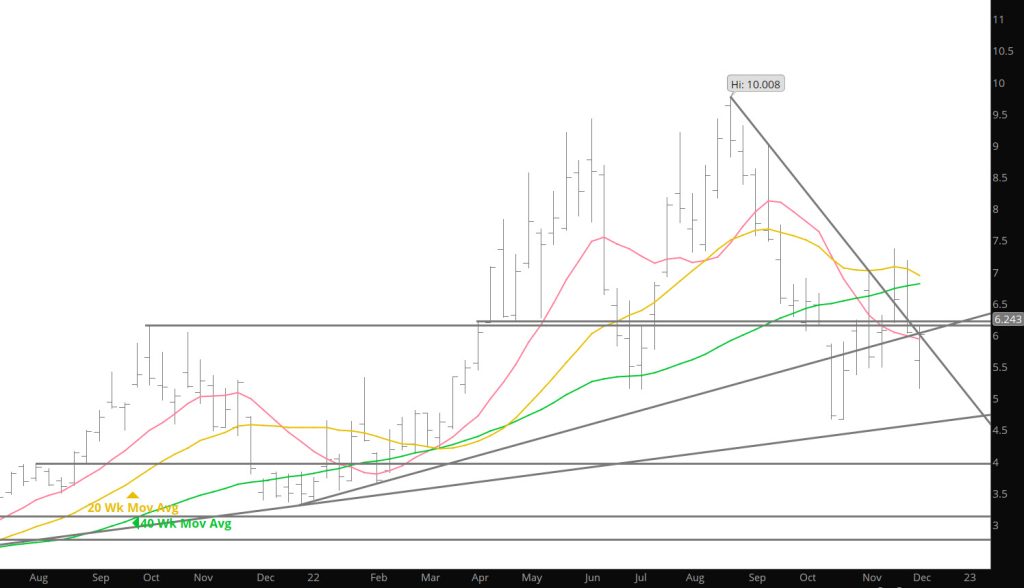
January opened with a gap sharply lower from the previous week’s close at $6.281 to $5.900, through support defined by a series of lows traded by January gas between 11/09 and 11/16 ($6.131 – $6.260) and January’s November low ($6.011). The downside momentum generated by the exceptional gap triggered a substantial volume increase and a near immediate test of the continuation November low ($5.614 corresponding to January’s October low, $5.645). On a daily closing basis, prompt gas held the November low on Monday ($5.624 vs $5.614) but trade suggested that those lows were vulnerable to test the June/July lows $5.325 – $5.357. Last week’s low was $5.337.

Prompt January held the support and reversed higher but the odds of closing the weekly continuation gap left on Monday, which remained open between $6.052 and$6.221 were so remote the potential was not even mentioned in the Daily. Sure enough, it was and then some. In a year of improbable occurrences (the first ever annual high during calendar August, so far, for example) January rallying $1.054 after a high – volume gap down followed by the test of lows traded during the summer was one of the more near – term remote probabilities.

To read The Daily Call you must be a subscriber (Current members sign in here. ) Start your subscription today.

Bias Switch

Weekly Continuous

The break down of the trend line (mentioned on Friday) was a clear signal that prices were headed lower. That is why some of these technical levels are so important– they signal break down’s or break out’s. From there the question remained would the break out area around $6.45 hold which it did momentarily before capitulating, opening the door for prices to collapse another $.20. It is clear that the historical trend of weaker prices into early December remains well in place. The consensus of technical indicators had made steady, incremental progress since late October, gave up most of that improvement and retreated to neutral with a price negative bias.

Market internals were mixed during the past week but not nearly as weak as one might be expect given January’s reversal lower, average daily volume was much less than during Thanksgiving week by an estimated 90,000 contacts. Volume is supposed to expand if a substantial price move is sustainable.

To read The Daily Call you must be a subscriber (Current members sign in here. ) Start your subscription today.

Break Out Through Resistance

Weekly Continuous

As mentioned in the earlier Daily and Weekly writings, the area around $6.45 was key and the action last week confirmed as a rally broke above and sent the soon to expire over $7.00 quickly. Due to the light holiday related trade and the fact that the virus has returned to my chest — I will keep today’s Weekly Comments short. This last week’s exceptional counter seasonal price strength managed to pull the remainder of the winter strip back to and just above its still rising 40 – week SMA. Mentioned “counter” because there is historical evidence that the period around the Thanksgiving holiday is weaker (usually after trading to a pre-holiday high). Perhaps this year will resemble the historical norms with prices weaker during this week’s trade.

The technical indicators…which is heavily weighted to prompt gas, moderated last week and showed improvement this last week. The volume traded during three- and one-half trading days was nearly as high as five trading days last week…average daily volume increasing an estimated 95,000 contracts as prompt gas rallied to and through moving average, conventional and trend line resistance. Open interest declined modestly, suggesting that short covering played only a minor role in the rally—or that new buying was sufficient to offset what was likely a more significant amount of buying to cover contracts previously sold short.

To read The Daily Call you must be a subscriber (Current members sign in here. ) Start your subscription today.

Consolidating For a Run or Break Lower

Weekly Continuation

After a “somewhat” calm wee of trade the question that was mentioned in the Daily –Is gas constructing a base to resume the secular uptrend higher or is it consolidating after a substantial decline during the nine weeks between the August high and the October low, thereby allowing the extremely oversold conditions to moderate, before another “leg” lower. Both directional bias’ seem to have significant contingencies which means that violent whip saw action may occur.

For the market to advance after building this base, a violation of the intermediate downtrend line will suggest that the decline from the August high ($10.028 – $4.750, 52.6%) has likely concluded, but not necessarily that a serious rally will follow. Higher levels of resistance, not limited to the the November reversal high and the still rising 40 – week SMA, are formidable areas. Three of four higher weekly closes suggest that December is gaining the sponsorship for a successful test of the declining resistance. Violation of the trend line and a weekly close above $6.459 will suggest that prompt gas has traded the first higher close of a new intermediate term uptrend (as discussed in the Daily).

To read The Daily Call you must be a subscriber (Current members sign in here. ) Start your subscription today.

Reversal Week

Weekly Continuous

I have no clue what stimulated the market to the opening gap of that size (last Monday) but it took the prompt through the still rising 200 – day SMA. The run did not last long as December quickly fell to close the gap and continued lower. After back – to – back weekly gains, the first since the final run to the August highs, on Friday a failed recovery attempt, terminated ending up as a downside reversal from just above the previous week’s high to close the reversal lower. The week ending daily reversal left December back below $6 (where most of the trade during it’s tenure as prompt has been spent). Critical support for December is between there and its October and to date November lows ($5.345 –$5.614). Events like this week’s reversal following an opening gap and then the moving average cross along with other factors suggest that rallies in December gas will be enthusiastically sold.

The last time the continuation 10 – week (SMA) crossed through the 40 – week was during January AFTER the construction of the December ’21 low and remember moving averages are always “lagging” indicators. The 10 – week remained there for several weeks until prompt gas kicked off on the late winter/early spring rally.

To read The Daily Call you must be a subscriber (Current members sign in here. ) Start your subscription today.

Break Above Gap

Daily Continuous

December gas rallied on somewhat increased volume to close the continuation gap left on 10/17 and then fell to test support. The week ended with strength as prompt gas rallied to a higher high and closed above the previously filled gap, the declining 20 – day SMA and the June/July lows.

To read The Daily Call you must be a subscriber (Current members sign in here. ) Start your subscription today.

Dec Takes Over as Prompt Giving Up Some of Differential

Weekly Continuation

When trading was initiated, the declines from the previous week were extended another $.153. Extremely oversold, about to expire November reversed from a “sold out” condition, and rallied almost exactly a dollar (21%). November traded a $.755/dt range on its last trading day, then settled with one of the widest closing range in memory $4.948 – $5.438. After a brief failed attempt to build on the extraordinary premium awarded over expired November ($.689 vs $.004 a year ago and $.295 in ’20), new prompt December, which had traded as high as $6.281 fell to $5.547, before finding support and ending well off the low.

Over the last couple of week’s there has been discussions of the “technical damage” that occurred to the charts during the rapid declines in October. The violations of trend line, moving average and conventional support that occurred almost entirely without any intervening rallies. While this week’s reversal was a strong suggestion that the gas market was “sold out”, the market has a lot of work to do before any significant rally can be sustained. Further evidence of that can be found in the market’s inability to hold onto gains (selling the rallies concept). December closed $.579 lower than the high it traded on Tuesday with selling clearly evident at its 10 – day SMA from Tuesday until Friday, $.339 off its low. The most important factor for December will be whether it can consolidate within the range it traded during the past week. If it is unable to do that then look for a test of the low of November’s closing range ($4.948).

To read The Daily Call you must be a subscriber (Current members sign in here. ) Start your subscription today.

Technical Destruction of 2022 Bull Bias

Weekly Continuous

The previous Friday’s close left the prompt below its 40 – week and the observation was made that in response to the weak close was that the violation of an important trend line should considered a potential. Prices didn’t take long for the market to resolve that potential and the prompt gas gaped through the trend line leaving a weekly (and daily) continuation gap that the November contract never threatened to fill.

The expectation if the critical trend line failed to continue to limit the decline was a test of conventional support presented by the June/July lows at $5.33and likely during November’s tenure as prompt. That didn’t take long either to blast that support. An absence of buyers and abundance of sellers drove the prompt lower each day. On Thursday November traded through the last higher low of the long 2022 uptrend.

To read The Daily Call you must be a subscriber (Current members sign in here. ) Start your subscription today.