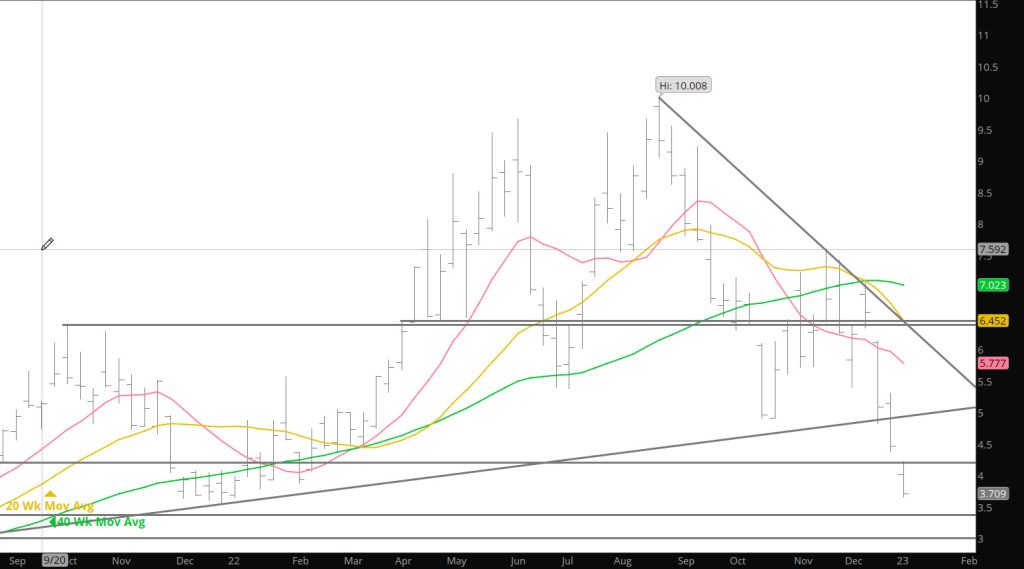
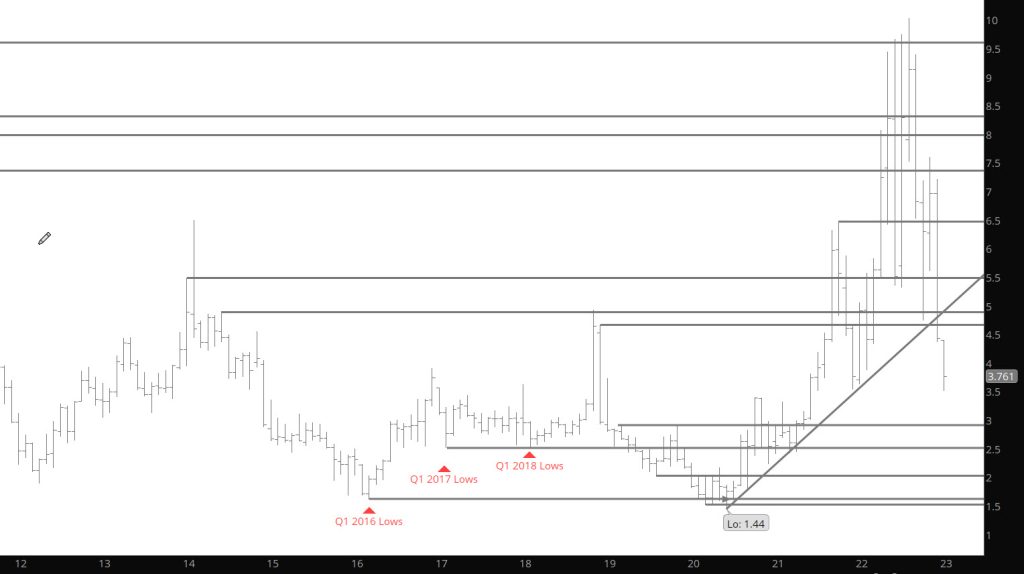
The uptrend that first began following the June ’20 low, was conclusively ended when the calendar December close for prompt gas was below the trend line drawn from that multi – year low and the December ’21 low (See Monthly Continuation chart above). That does not mean that the gas market is headed to zero or even back to test the last multi – year low, but the downside momentum that began to be generated by the bearish momentum divergences that accompanied the August high is likely to take some time to be completely neutralized. While it may not seem so, price volatility has actually decreased…the weekly ATR (the average range of the last fifteen weeks) has fallen from $1.413 on 07/29 to $1.091, over the last few weeks from $1.155. This week’s range was $.874 the narrowest since mid – November.
That said, a volatile rally is overdue. Over the last four weeks since the seasonal early – mid December high on 12/13, prompt gas has fallen from $7.105 to $3.520 (over 50%). In the process the gas market has finally reached an extremely oversold technical level. The weekly RSI ended the week at 24.29 that has the “leading” indicator, lower than that for one week during October, which was followed by a weekly reversal and a rally from $4.750 to $7.604.