Consolidation — Range Trade

Weekly Continuation

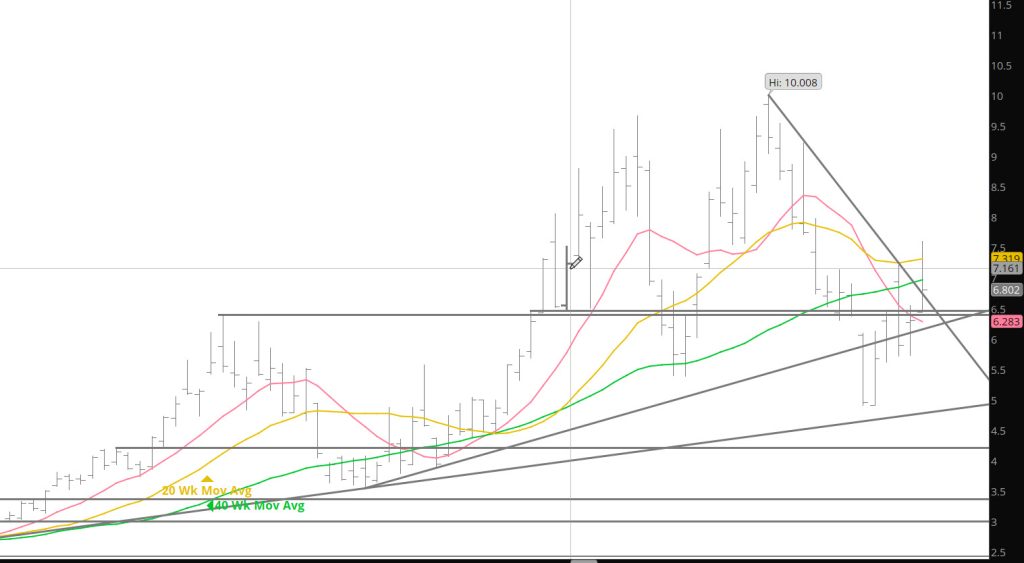
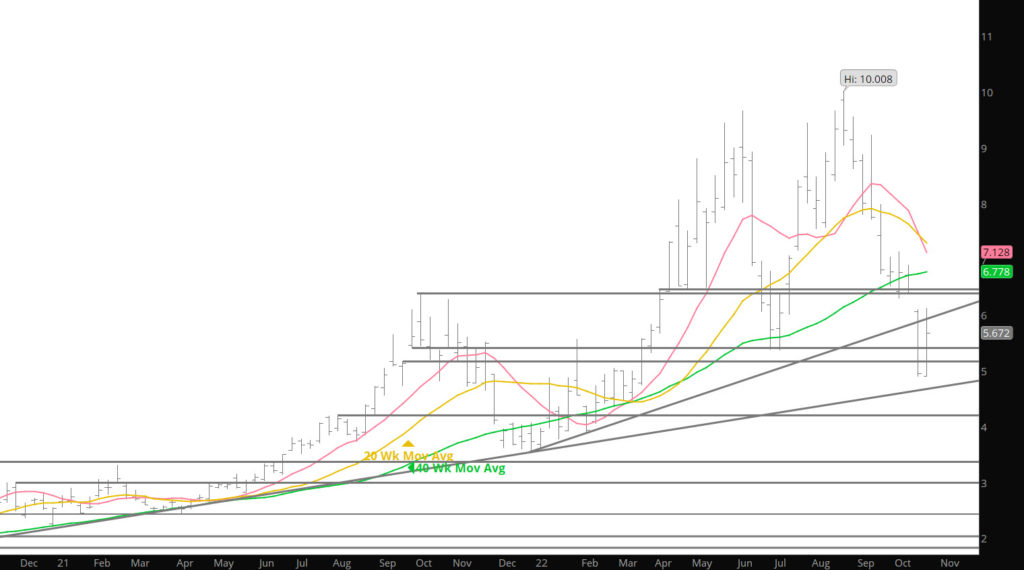
This week’s decline was the seventh straight lower weekly close since then prompt September failed to hold onto or extend the rally through $10. The most recent period that there were seven consecutive lower weekly closes was between mid – November ‘14 and mid – January ’15. After one recovery week prompt gas fell for three more weeks. Before that there were nine straight lower weekly closes during the late winter/spring of 2012. That decline culminated in the April ’12 multi – year low.

Since the August high prompt gas has fallen $3.723 (37%) as a reversion to the mean has again brought it from substantially above the 40 – week (55%) to this week’s close below it (Nov contract) for the first time since the first Friday of 2022.

To read The Daily Call you must be a subscriber (Current members sign in here. ) Start your subscription today.

Counter Trade Rally Ends Just Over $7.00
Weekly Continuous

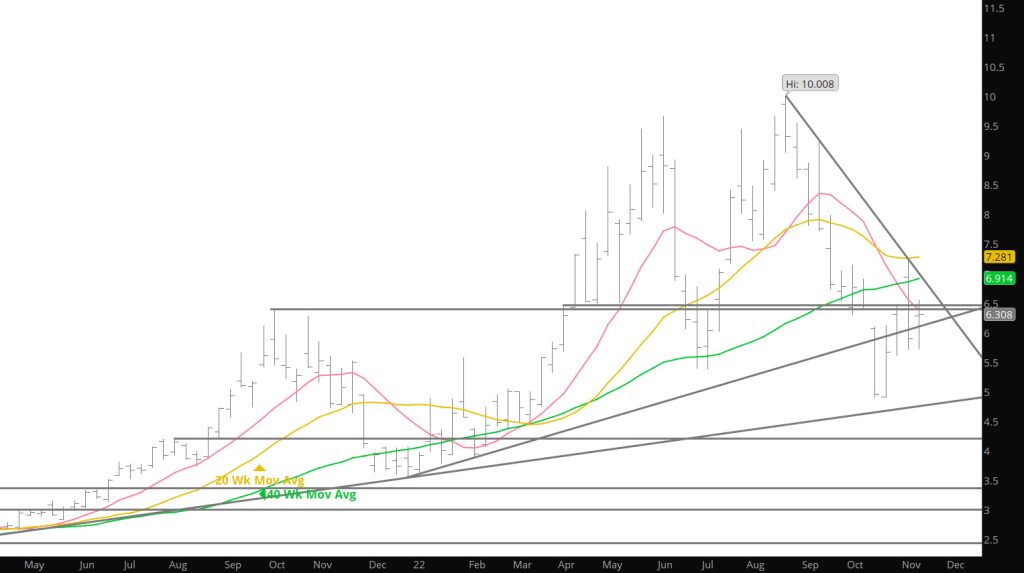
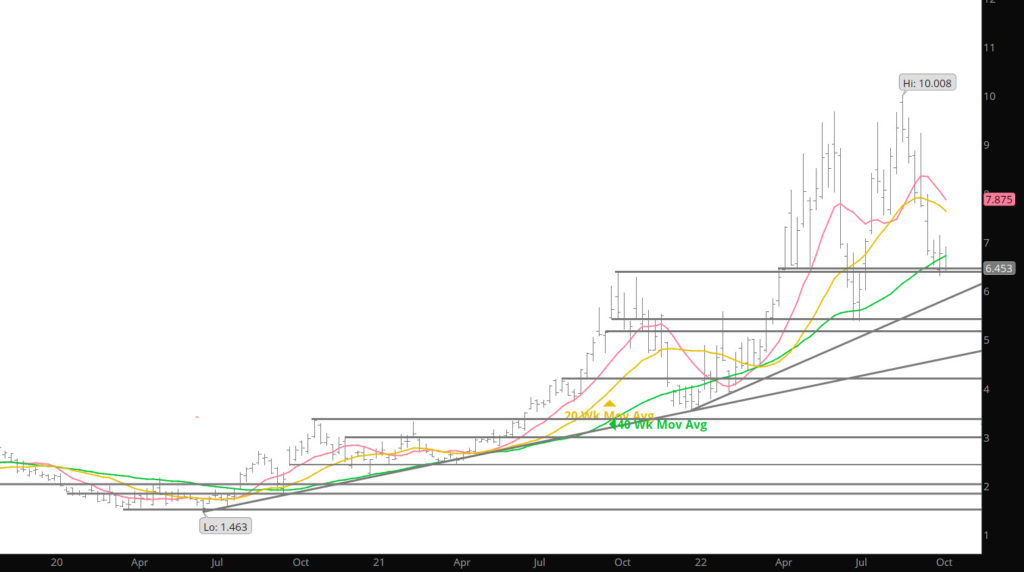
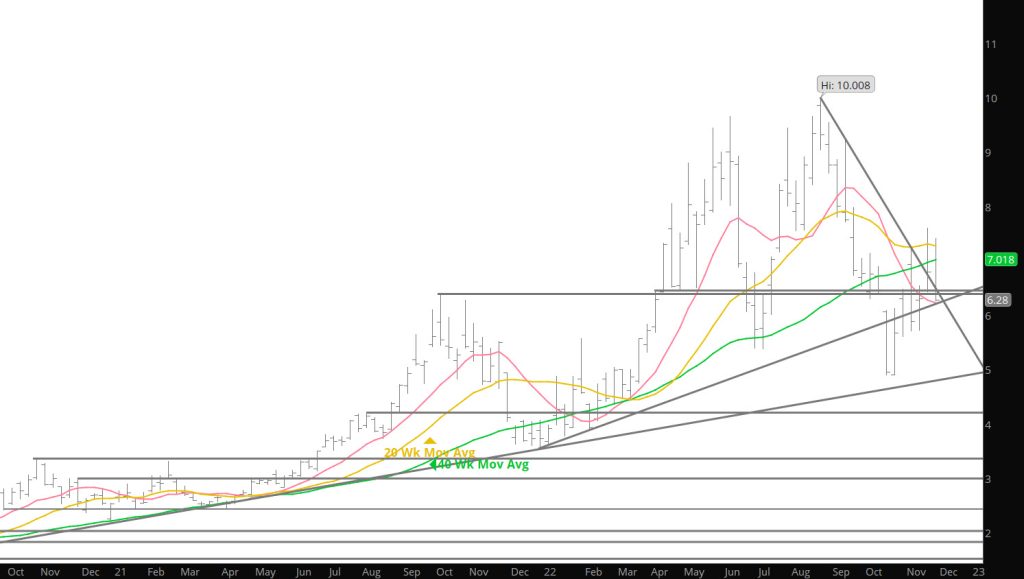
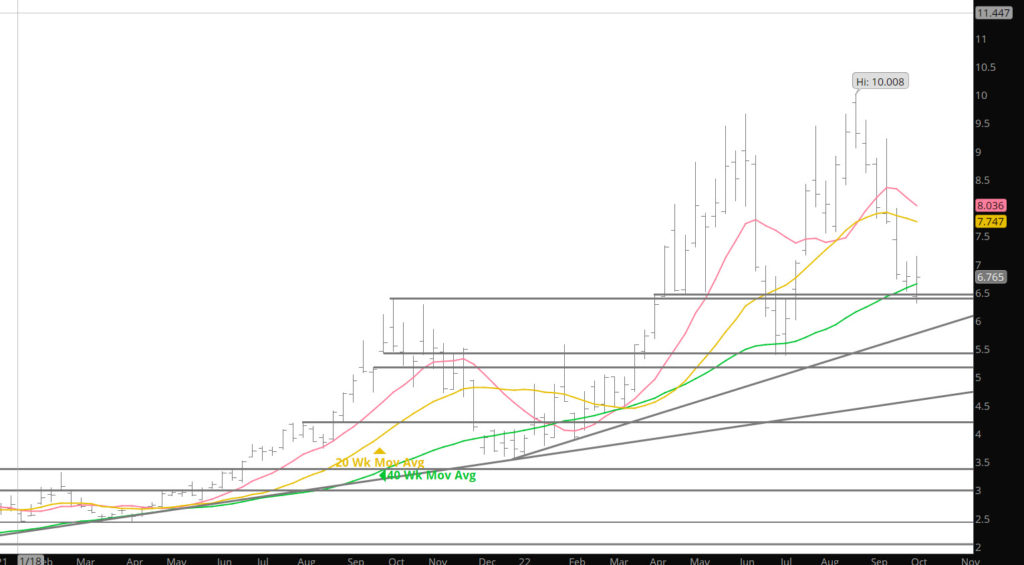
Prices rallied from that rising support off of the support from the 200 day and 40 week SMA’s and extended that rally through the previous week’s high. An “outside” week (trading through both of the previous period’s extremes) reversal is often characteristic of an intermediate term low (or high), but November was unable to hold on to/build on the rally gains. Prompt gas finished the week lower for the sixth straight week since trading the late August multi – year high just above $10. The closes of the last three weeks have been progressive lower, but are within $.093 ($6.841 – $6.748)

The last time a series of weekly closes were as closely bunched was during the construction of the December low. From week ending 12/17 through 12/31 there were three weekly closes between $3.669 and $3.760. Those “tight” weekly closes were an indication that after thirteen weeks the intermediate term downtrend from the October – Q4 high was “sold out”– The jury is out regarding this technical event.

To read The Daily Call you must be a subscriber (Current members sign in here. ) Start your subscription today.

Nov Shows Mild Strength in Early Trade as Prompt
Weekly Continuation

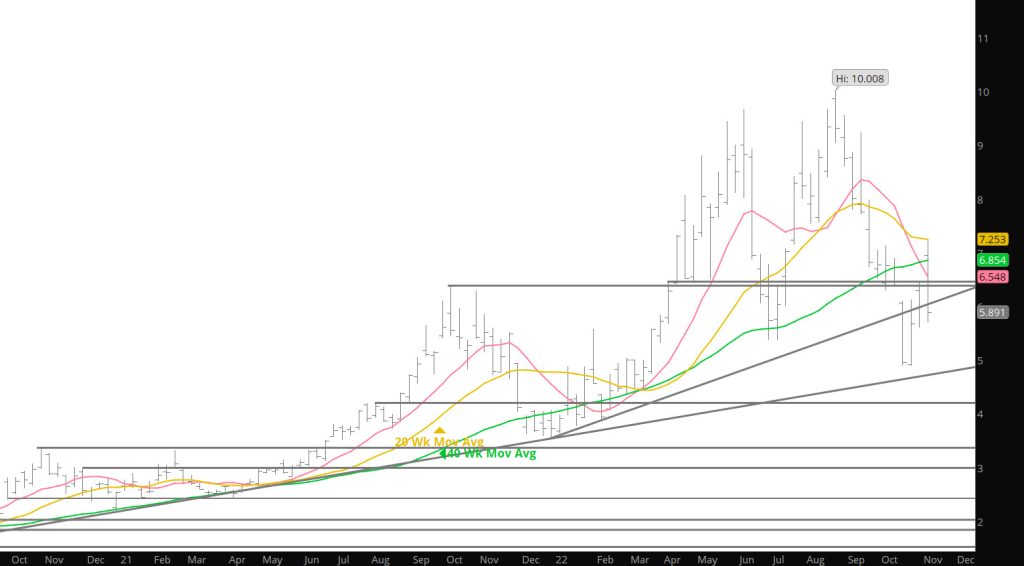
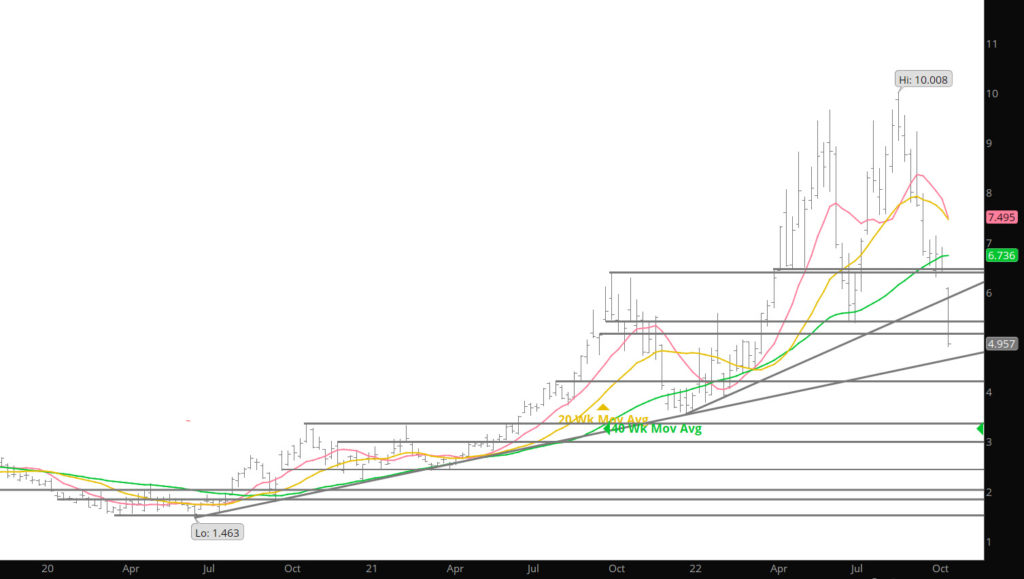
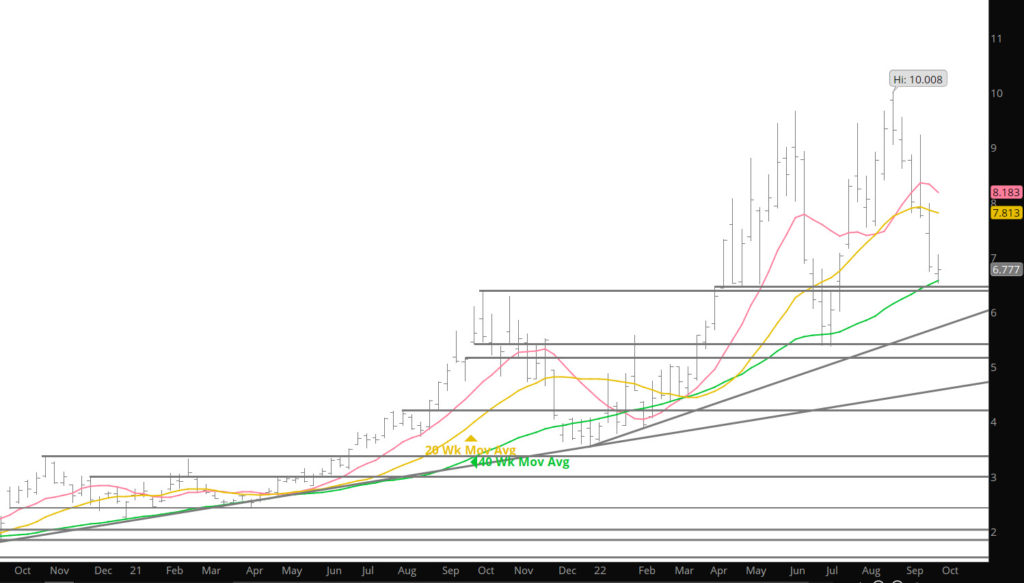
The expiring October rallied from $6.456 to $6.901 before going off the board at $6.868. This was the third highest expiration this year but $2.485 lower than September. The average settlement for ’22 is currently $6.783.

For more than a year and a half expiring contracts have rallied before going to settlement, discussed here nearly every month, October did so, but the substantial decline to an expiration day low (also the low for October’s tenure as prompt), before that rally suggests a departure from the long – standing pattern but not necessarily the trend.

To read The Daily Call you must be a subscriber (Current members sign in here. ) Start your subscription today.

Exciting Week With Ramifications

Weekly Continuation

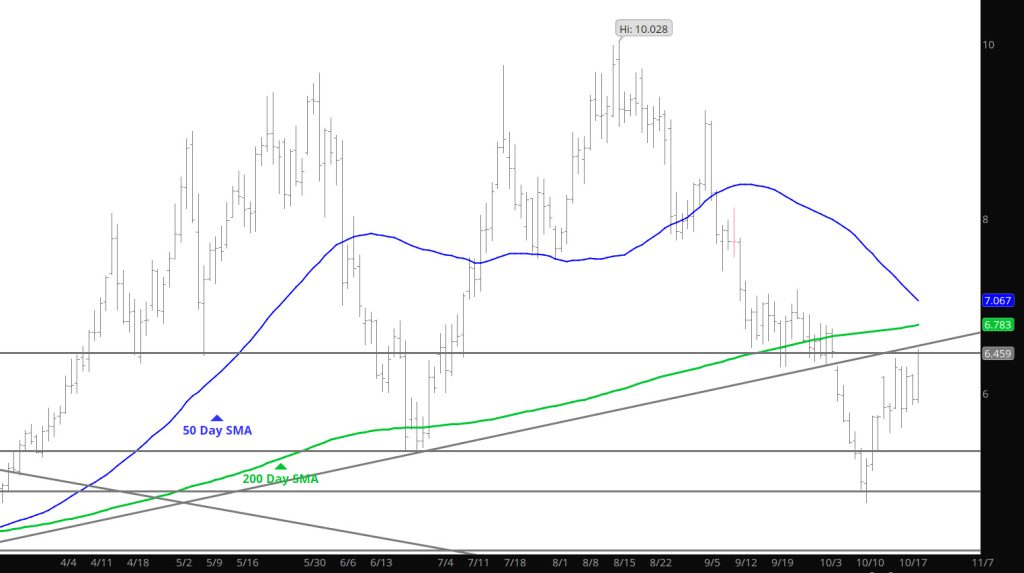
Contrary to the writings this summer, October tested the August lows ($7.532 – $7.550) and broke below as support could not hold that area. For only the second time in the last ten years, the August lows broke down in September. When there was insufficient sponsorship for near term gas to hold the well – defined support, October plunged to a low of $6.737, as trading for the week concluded . To a lesser degree, it took the rest of the maturity curve and strips followed the declines. Neither of the two previous violations of the August lows (in ’20 prompt gas traded an “outside” month reversal to the upside and, in the other -’15- prompt gas was in a downtrend already 18+ months old), appear to present an acceptable similarities for the remainder of ’22.

Serious, resistance has been clearly defined by multiple calendar month highs from May through September, all between +/- $9.40 and $10.028, but where is support sufficient to overcome the momentum built to the downside since the failed late August breakout? Since prompt gas first closed over the continuation 40 – week SMA in August ’20, the rising moving average has been tested multiple times recently at the July – Q3 low. Only during December ’21 has it been violated on a weekly closing basis for more than a single week. Currently the value of that rising moving average is $6.489. For several weeks there has been the exceptional separation from intermediate/long – term trend defining 40 – week SMA (the high weekly level was 55% above that Average). While it sometimes takes longer than we think to materialize, prices should trend back toward the mean mean is as close as it gets to a technical certainty. Currently the separation is 5.2%. It should be noted that before the July low was traded the week ending separation reached 2.6%. During that week prompt August traded +/- $.23 below the moving average, before prompt gas turned and rallied to a higher high.

To read The Daily Call you must be a subscriber (Current members sign in here. ) Start your subscription today.

Price Collapse

Weekly Continuous

Prices declined off of the “fake” rally on the rail strike and closed the week down. The “outside” week range with the close approximately equal to the previous week’s low is a significant technical negative. The coming week will be critical for October. Given the weekly reversal, weak close, the first close under the continuation 20 – week SMA since the week of the July Q3 low, the technical odds favor further testing of the last two weekly lows. Violation of that recently support would suggest an immediate test of the August lows $7.532 – $7.550 (the August low of October gas was $7.536).

Market internals continue to provide little support for any continuation of the uptrend…and not much more for extension of the decline from the August high. This week open interest declined as prompt gas rallied to close higher from Thursday to Thursday…a neutral indication at best. Open interest has remained in tight range all summer . Average daily volume was just about unchanged even though volatility increased– neutral.

To read The Daily Call you must be a subscriber (Current members sign in here. ) Start your subscription today.

Near Term Support Holds For Now

Weekly Continuous

Prices extended their decline on the return of trade after the weekend. As discussed, this period of the year is one on the most bearish periods for trade during the year. The declines last week sent price below the 50 day SMA for a close below that zone for the first time since mid-July . The zone between the 50 – day SMA, this last week’s low, and the August low ($7.532) is serious support for October and for the intermediate term uptrend that began following the July low.

With a consolidation pattern developing, the technical indicators typically fluctuates between neutral with a price positive bias and neutral with a price negative basis while a trading range is being constructed. Open interest was steady as the market fell to close lower (a slightly technical positive, but that was offset by increasing volume) . Volatility remains historically extreme with this week’s range $1.375 was greater than the 15 – week average ($1.300). Before the gas market is ready for another leg up daily and weekly ranges tend to compress as buyers and sellers approach a balance forming an equilibrium of a sort.

To read The Daily Call you must be a subscriber (Current members sign in here. ) Start your subscription today.

Seasonal History Wins

Weekly Continuous

Spoke in the last Weekly that last week was going to be a struggle between the trend of well bid expiration’s and the weakness associated with the Labor Day holiday (one of the historically weakest periods for natural gas). While the expiration went off rather benignly, prices collapsed on Friday before the extended weekend.

As mentioned in the last few Wekly’s, the period bracketing Labor Day is one of, if not the most consistently price negative all year. Typically, prompt gas trades to a late August high and then declines to a post – holiday/mid – September low.

To read The Daily Call you must be a subscriber (Current members sign in here. ) Start your subscription today.

Potential Issue

Daily Continuation with Potential Inverted Head and Shoulder Pattern

Spoke over the weekend about a technical formation that has the “potential” for issues with Nat gas. It has to deal with the developing inverted head and should pattern in the Daily chart. Not saying that this will happen but would be remiss in not bringing it to you attention. The chart above has the two shoulders and the inverted head highlighted.

Technical doctrine holds that the mathematical objective of the violation of the “neckline” of a fully formed head and shoulders construction is an extension approximately equal to the distance from the top of the head (in this case the bottom) to the neckline. Using that metric suggests a target of $14 (9.670 – 5.325 = 4.345 + 9.670 = 14.015).

To read The Daily Call you must be a subscriber (Current members sign in here. ) Start your subscription today.

Market “Seems” Strong

Weekly Continuation

There will likely be two Weekly reports this week as the market performed and interesting technical formation of late. There will not be a Weekly next week as I have my annual fishing trip to Canada late this week and internet service is sketchy at best.

First off lets review last week’s action–While on a trading basis September did fail at lower high ($9.677 v $9.752) on a daily ($9.336 v$9.322) a continuation basis prompt gas set new closing highs. There were new closing highs in the Winter ’22 – ’23 strip ($8.991 v $8.779). To this trader, these are warning signals for the Q4 and Q1 action.

To read The Daily Call you must be a subscriber (Current members sign in here. ) Start your subscription today.

Late Summer Range Continues

Weekly Continuation

Since the June Q2 high it has been expected that prompt gas would define a summer trading range not from the July low to the June high (nearly $4 between the upper and lower extremes) and perhaps the trade in the last couple of weeks has develop a narrower range. While the question is not completely settled, the rallies of the last two weeks go a long way toward tightening the lower boundary of that range just above $7.500 and the June highs. Would continue to expect a tighter range to be defined.

Calendar August (with Sept as prompt) has historically been a period of seasonal weakness, occasionally spilling over to the first part of September. Even in the last two years when there has been counter – seasonal strength during September’s tenure the prompt traded down from highs in early August. Last year prompt September traded from $4.205 down to $3.734 on 08/19.

Volatility remains extreme–the total range traded this week was $1.387…the weekly ATR (average true range of the last fifteen weeks) is $1.392. A year ago the 15 – week average was $.271. Volume was slightly higher (25,000 average daily) but open interest continued to decline slightly. A large portion of the declines in OI was Thursday on a high volume day as prices rallied from $8.22 to the week’s high just short of $9.00 after the storage inventory release.

Continue to expect higher prices during Q4 & potentially into Q1. It is worth remembering that the rallies from Q3 lows have averaged about 74% over the last twenty years (60% over the last ten, 76% over the last five) and that Q4 highs have been higher than Q2 highs fourteen of twenty times. Q4 highs have been higher than Q3 highs in every year since ’00 except ’01, ’08, ’10, ’11 and ‘14.

Major Support: $7.55, $7.14, $7.078, $6.88, $6.754,$6.38, $6.02, $5.623,
Minor Support:$7.35, $7.41, $6.42, $5.548, $5.40-$5.45
Major Resistance: $8.95, $8.996-$9.057