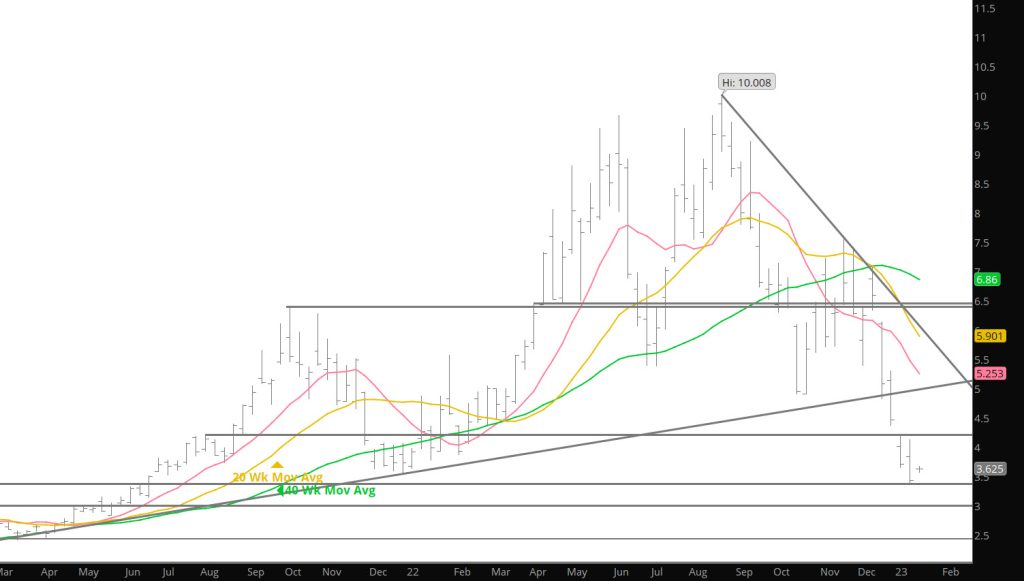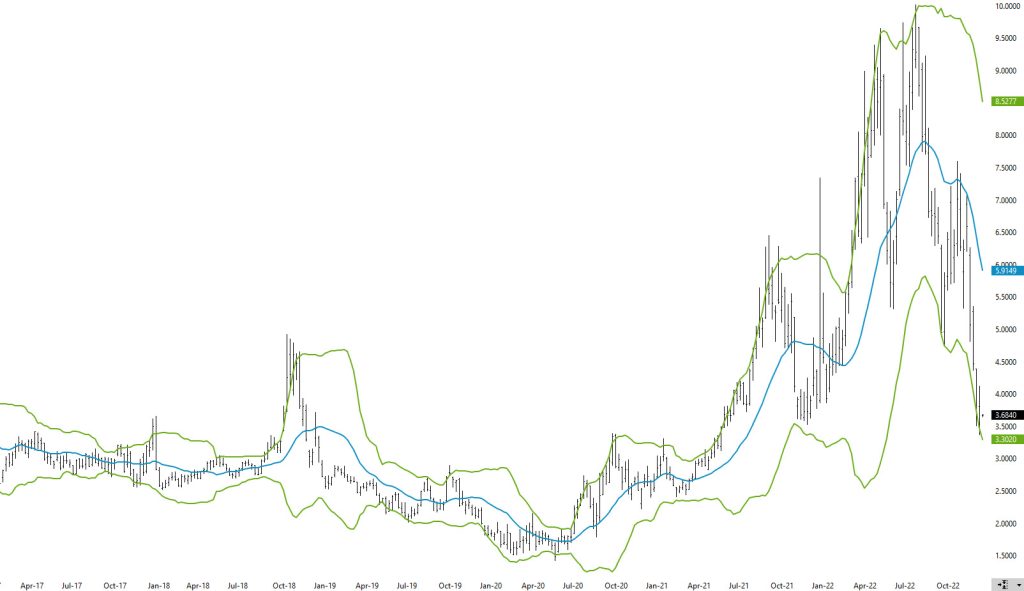
The current natural gas market is dissimilar to last year (from a technical standpoint) as prices are now developing over-sold conditions from declines that commenced last September. As the weekly chart (with Bollinger Bands) shows below, the market is now trading at 2 standard deviations below its 20 week moving average (last week’s close) —a level that historically does not maintain the market for very long and usually presages a rally or series of rallies.

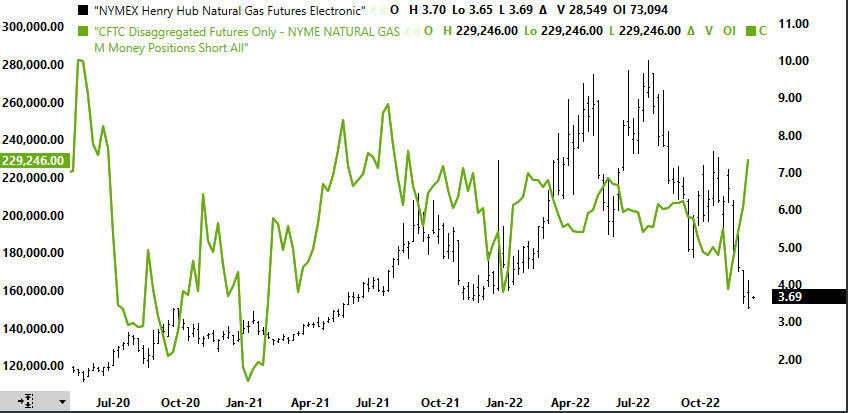
It is also concerning, that the declines of late have caught the interests of the speculators. The latest Commitment of Traders Report has the Managed Money Short positions increasing their short commitments with the expectations of further declines.

The increased attention from the speculators to the price action suggests that there will likely be upcoming volatility in the market. When this group comes into a market aggressively—it sets the market up for violent short covering rallies when the prices find support. Exposure to these rallies should be minimized by a hedging strategy.
Expect rallies off of support and should these rallies break some key resistance areas — forcing the shorts to cover some positions– the rally may become violent.
Major Support: $3.638-$3.536
Minor Support:
Major Resistance$4.22-$4.39, $4.75-$4.825, $4.948, $5.056
