Bullish Move But Caution

Weekly Continuation

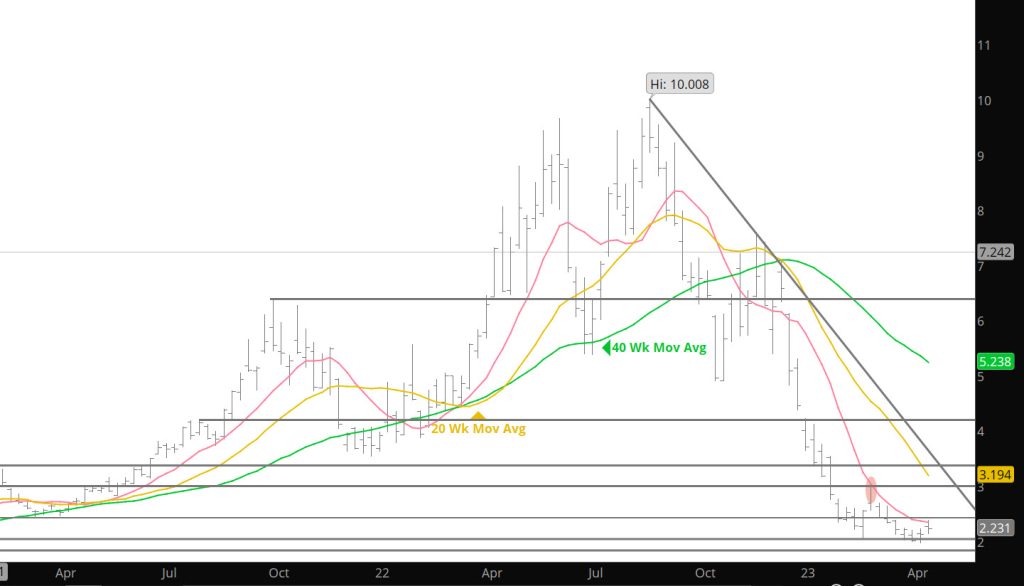
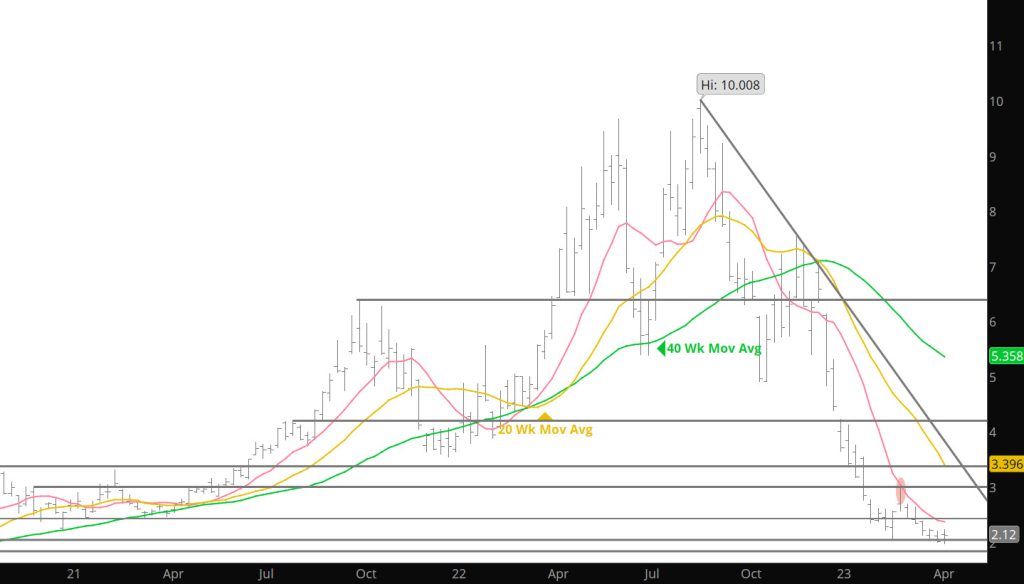
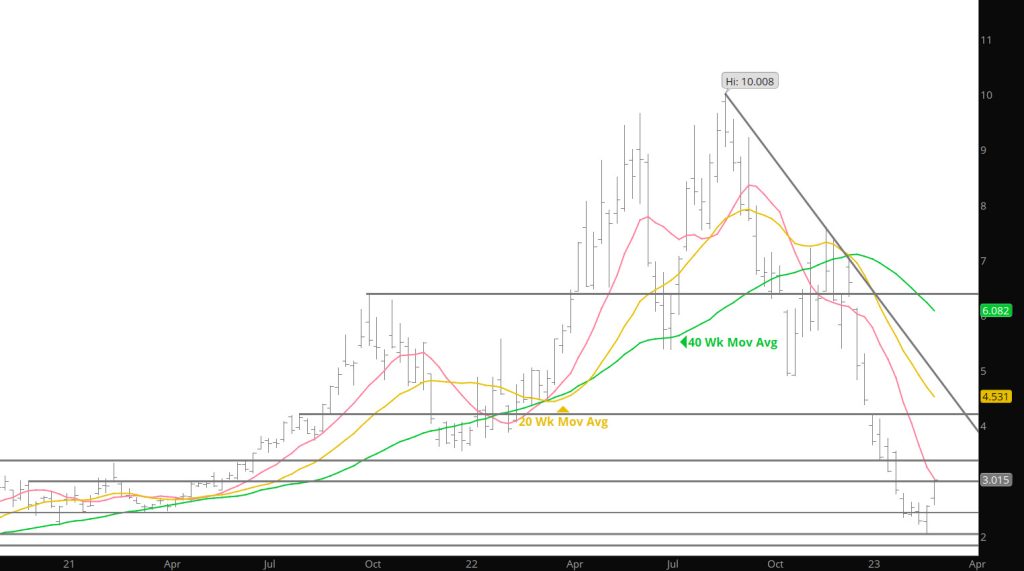
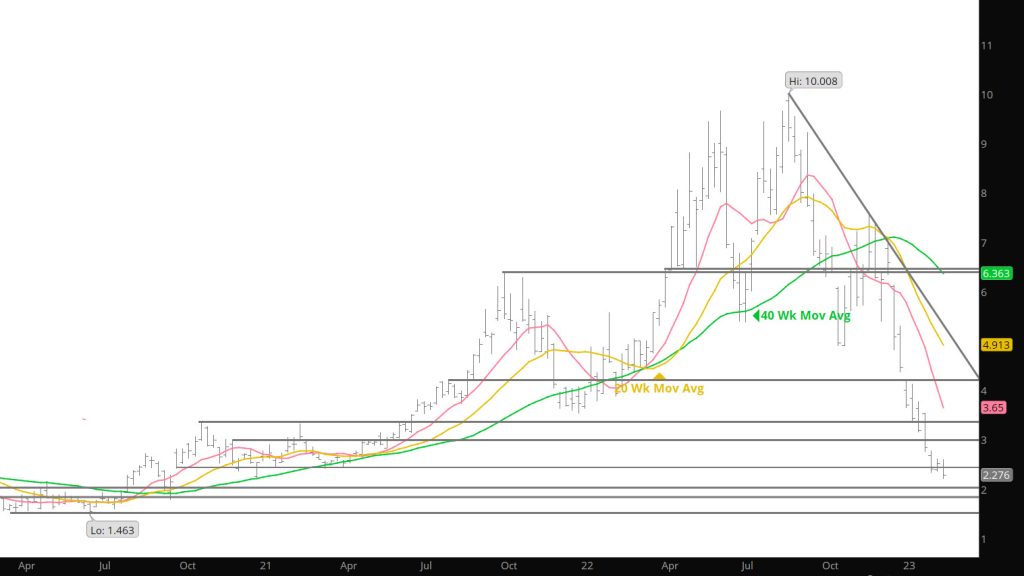
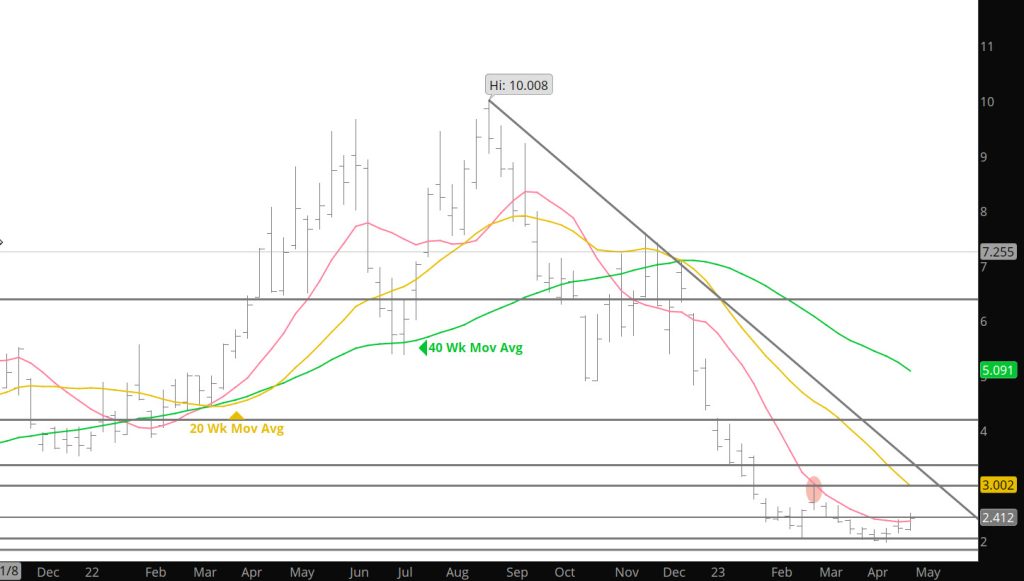
Prompt gas finished higher for a second week and the third time in the last four. Consecutive higher weekly closes have not occurred since the rally from the October low and prompt gas had not been higher in three of four weeks since the portion of the rally to the August high. Those rallies failed but failure currently will just test support zones not the declines we saw in the fall (sorry — don’t see prices to zero).

Weekly charts give useful information for purposes of hedging and term positioning vs Daily charts which are quick snapshots of what short term actions are coming. For an intermediate/long – term perspective the monthly charts are invaluable for filtering out distracting trading “noise”. For example, the June ’21 breakout through the Q4 ’20 high was an ominous warning of an extended period of higher prices. Last summer there was a warning of a different type, this one in the form of an extremely rare monthly event which was back to back “outside” months during calendar June and July (it is unusual if that occurs on a weekly basis at the least). That event was noted at the time along with a discussion about weekly volatility. Rare monthly events always send a message. The market may have sent another one by the price change during February.

To read The Daily Call you must be a subscriber (Current members sign in here. ) Start your subscription today.

Market Bias Maybe Changing

Weekly Continuous

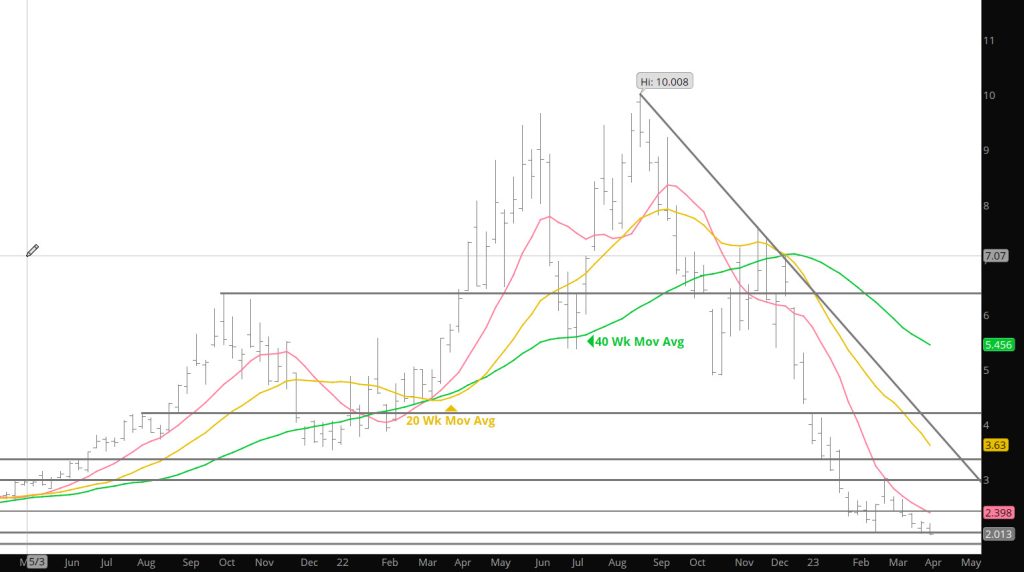
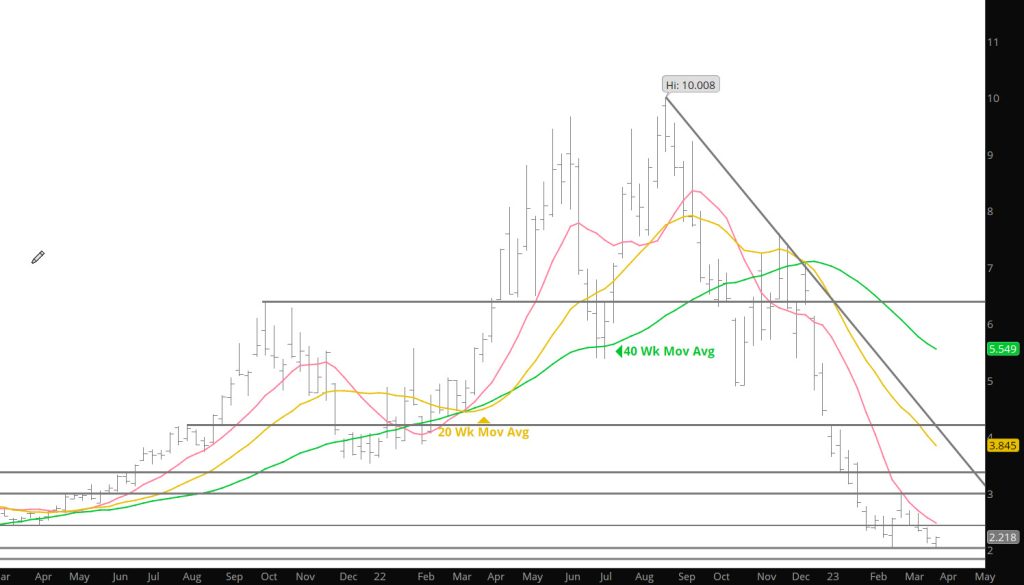
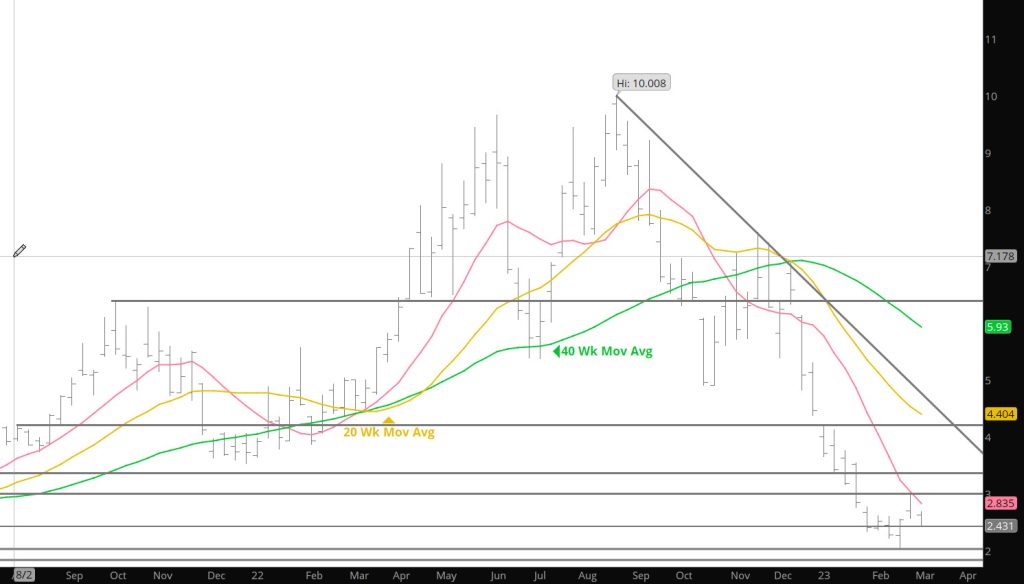
After trading to $1.967 March rallied into expiration to settle at $2.451 (+$.484). Even with positive closes for its last two trading days, it was the lowest contract expiration since October ’20 settled at $2.101. It doesn’t seem like much, but prompt March rallied to close higher in two of the last three weeks, perhaps a redefining event– more importantly, the deferred contracts rallied a fair amount more than they did two weeks ago. For example, when March ended week ending 02/10 $.121 higher the summer strip was $.099 higher, winter ’23 – ’24 $.020 higher. This week with prompt gas closing $.176 better the summer was $.203 higher, winter $.128. Given the magnitude of the declines in those strips over the last few months, that may not seem like a big deal, but perhaps the gas market is beginning to change.

Following that first print under $2 since prompt gas spent about a week there while constructing the September ’20 low, March reversed higher accompanied by increasing volume (due to the Holiday shortened week I will us the average daily volume did increase modestly) Tuesday – Thursday was greater than the corresponding days the prior week when March was falling. Weekly reversals more likely when they begin from an undercut of a previous weekly low and an extremely oversold condition, have long been the gas market’s preferred method of communicating that the price pendulum had swung too far one way or the other. Often those reversals create momentum divergences because mathematical indicator. In this case the the weekly RSI, didn’t have time to catch up to confirm the lower price low (these divergences have been discussed previously).

To read The Daily Call you must be a subscriber (Current members sign in here. ) Start your subscription today.

Bears Continue to Rule

Weekly Continuation

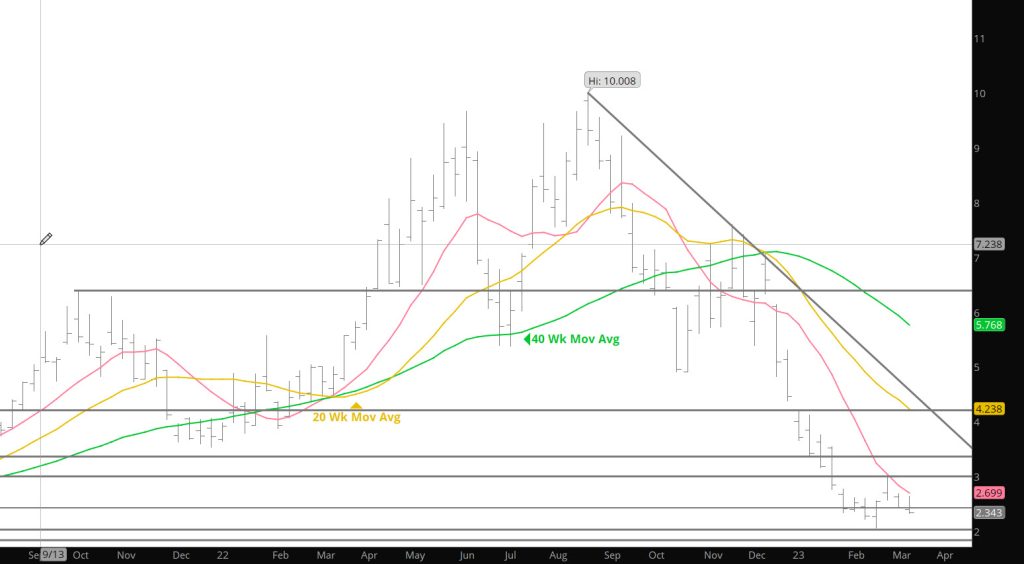
This week’s decline left the March contract and the deferred contracts below all closely watched moving averages. These levels have the weekly closing price at lows not seen since late September ‘20. Readers are no doubt familiar by now with the technical presumption that arises when price ends the week below the prior week’s low. More meaning is added to that presumption when the close is at a multi – year low. discussed last week about the market developing a “bases” or a consolidation range for which prices can rally or decline.

Primarily because of the gas market’s persistent extremely oversold condition my thoughts were strongly suggesting that the twelve – trading day range since the beginning of February was likely the initial stage of the construction of a defensible low. Undercutting the consolidation range puts that theory to rest (for now) but does not change the current extreme position the market is in nor the expectations of the near term future. Beyond that, acknowledgement that the historically disproportionately important January low, which withstood another challenge, there is little to add other than the eighth decline in nine weeks has left the consensus of technical indicators (which improved a little last week) profoundly negative, some indicators more oversold that at any time in the history of trading natural gas futures.

To read The Daily Call you must be a subscriber (Current members sign in here. ) Start your subscription today.

Further Evaluation

Weekly Continuation

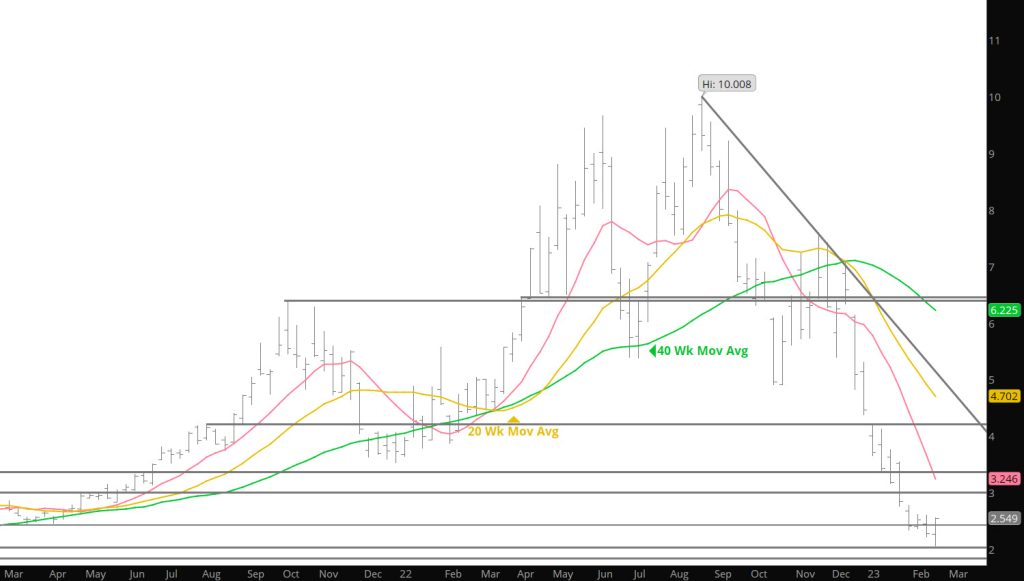
Feeling better and capable of bringing thoughts together I offer this Weekly updated for this week’s action. It may be that the “inside” week (concluding last week) is just a pause for an astronomic oversold gas market, but I beginning to think that the downside momentum developed since those bearish momentum divergences way back in August is finally exhausted or getting extremely close to it.

The gas market fueled by speculative fervor (previously discussed Managed Money position short gains) characteristically take trends further than what is sustainable.. Prices did that in June ’20 when there were projections of a prompt price under a dollar then it did that back in last August when prompt September fleetingly visited the rarefied air over $10 for the first time since the hedge fund inspired run in the spring and summer of ’08. Last summer’s correction was quick and efficient.

My view is that the gas market has just begun the basing process and its early, only one week removed from trading a lower low, but most technical objectives have been met and then some. While the consensus of technical indicators is still solidly negative, the extreme state brought by the most recent phase of the decline (from the November/December highs) moderated a bit. The weekly RSI are still extreme and the RSI has ended in its EXTREME zone for the last six weeks…it has not done that since the decline from the ’08 high. Being extremely oversold does not mean that an indicator can’t get more oversold (witnessed that over the last few weeks), but that’s not the history of the purely mathematical indicators. More interesting is something of a change in the market’s internal characteristics during the past week. Volume has been increasing as the market fell that’s what is supposed to happen if a trend is to continue, but last week the volume starting increasing as the market rallied. On Tuesday 619,703 contracts traded…the highest daily volume since June 14th. The range traded that day was $1.881…the range traded on 02/07 was $.192. What I expected to see the next day was that open interest had declined indicating that a bunch of shorts had covered an existing position but that did not happen. Rather, open interest increased 7,362 contracts– that could show a strong indication that more than enough new buying came into the market to offset the amount of short covering. That is the first technical positive suggestion from market internals since the fall.

Major Support: $2.533, $2.422, $2.238
Minor Support:
Major Resistance$3.536, 3.595, $3.63, $3.789, $4.128, $4.22-$4.39, $4.75-$4.825, $4.948

Bull’s Stand Aside-Humor Will Come

Weekly Continuation

Have mentioned it every week for the last three and sure you are tired of hearing the over-sold condition of the market and that there will be a substantial short covering rally coming (just trying to figure out from where). Wanted to bring it into context by looking at the most recent CFTC data but they did not update data to last Tuesday in the weekly report on Friday– so the analysis is a little late but likely the same interpretation. Take a look at the charts below: The first the Weekly Continuation with Total Open Interest and Volume and the second is the CFTC report through the latest data.

Weekly Continuation with Total Open Interest and Total Volume
Weekly Continuation with Speculative Short Position per CFTC

The ellipses hi-light the trade November 6, 2022. Total OI was at 984,593 contracts and the Speculative shorts represented 180,931 contracts of the total. Obviously, the chart shows the enormous run that the speculative shorts have brought to the market, currently sitting at 250,915 contracts (growing 69,984 contracts). Total OI has grown to 1,168,247 contracts (growing 183,654 contracts). In the recent decline in prices the speculators are responsible for nearly 40% of the recent declines. It is little wonder that warning of the upcoming short covering rally (not sure from where) has been mentioned here.

To read The Daily Call you must be a subscriber (Current members sign in here. ) Start your subscription today.

Bearish Technical Indicators Continue

Weekly Continuation

Despite the rally on expiration (almost reminded me of several expiration’s last year) prices closed the week lower for the sixth consecutive week– clearly a bearish indicator for the week coming. Along with that expiration, March did not follow the gains rather, closing the week $.25 below the expiration of February.

Early indications have the week gaining open interest (even with expiration) with gains in volume week over week. The losses do come with an RSI reading that is in the extreme zone (chart below is after the Sunday opening).

To read The Daily Call you must be a subscriber (Current members sign in here. ) Start your subscription today.

Another Lower Weekly Trade

Weekly Continuation

Prompt gas closed lower for the sixth straight week (each week since the peak of the seasonal rally to a mid – December high – a one week uptick following a two week decline from the November high). Over those weeks, on a closing basis, prompt January and then February have fallen from$7.024 to $3.174. That kind of decline is not unprecedented, but it is rare and it has been a long time since last occurring.

There are other mathematical indicators that are used to monitor the overbought/oversold condition of the market, one such tool looks at the percentage the market trades as compared to the 40 week Simple Moving average. At Friday’s close prompt gas was 53.7% below the now declining intermediate – long defining moving average. You may recall at the high weekly close during August prompt gas was 54.5% above the 40 – week. Over the history of natural gas trading there has only been one other comparable rally and decline that carried to similar extremes.

To read The Daily Call you must be a subscriber (Current members sign in here. ) Start your subscription today.

Holiday Prices Bounce Off Support

Weekly Continuation

The current natural gas market is dissimilar to last year (from a technical standpoint) as prices are now developing over-sold conditions from declines that commenced last September.  As the weekly chart (with Bollinger Bands) shows below, the market is now trading at 2 standard deviations below its 20 week moving average (last week’s close) —a level that historically does not maintain the market for very long and usually presages a rally or series of rallies.

Weekly Continuation with 2 Standard Deviation Bollinger Band

It is also concerning, that the declines of late have caught the interests of the speculators.  The latest Commitment of Traders Report has the Managed Money Short positions increasing their short commitments with the expectations of further declines.

Weekly Continuation with Managed Money Short Positions

The increased attention from the speculators to the price action suggests that there will likely be upcoming volatility in the market.  When this group comes into a market aggressively—it sets the market up for violent short covering rallies when the prices find support. Exposure to these rallies should be minimized by a hedging strategy.

Expect rallies off of support and should these rallies break some key resistance areas — forcing the shorts to cover some positions– the rally may become violent.

Major Support: $3.638-$3.536
Minor Support:
Major Resistance$4.22-$4.39, $4.75-$4.825, $4.948, $5.056

Bull Run (Two Year+) Ends

Weekly Continuation
Monthly Continuation

The uptrend that first began following the June ’20 low, was conclusively ended when the calendar December close for prompt gas was below the trend line drawn from that multi – year low and the December ’21 low (See Monthly Continuation chart above). That does not mean that the gas market is headed to zero or even back to test the last multi – year low, but the downside momentum that began to be generated by the bearish momentum divergences that accompanied the August high is likely to take some time to be completely neutralized. While it may not seem so, price volatility has actually decreased…the weekly ATR (the average range of the last fifteen weeks) has fallen from $1.413 on 07/29 to $1.091, over the last few weeks from $1.155. This week’s range was $.874 the narrowest since mid – November.

That said, a volatile rally is overdue. Over the last four weeks since the seasonal early – mid December high on 12/13, prompt gas has fallen from $7.105 to $3.520 (over 50%). In the process the gas market has finally reached an extremely oversold technical level. The weekly RSI ended the week at 24.29 that has the “leading” indicator, lower than that for one week during October, which was followed by a weekly reversal and a rally from $4.750 to $7.604.

To read The Daily Call you must be a subscriber (Current members sign in here. ) Start your subscription today.