Issues Await

Weekly Continuation

July continued to closely follow the technical/seasonal script previously discussed. After testing the trend line rising from the April/May lows last Thursday and Friday the prompt rose to challenge the short – term trend line declining from the May highs. The falling resistance trend line was too much of a sell signal and ended the rally. July gave up the gain, traded .004 through last week’s close but stopped short of testing the trend line rising from the April/May lows before recovering to close above the trend line resistance. mentioned last week, a close above the short – term trend line would trigger a test of the intermediate – long term trend line falling from the August/November/December highs. The value of that declining resistance for the past week was $2.383 and the high was$2.380. Also suggested was that the prompt’s first challenge of the resistance would fail which it did. July retraced much of the week’s gain but trading a total range of $.207/dt, and remained well “inside” last week’s range.

It will get very interesting this week when prompt July encountered the trend line declining from the Q3 and Q4 ’22 highs and the trend line from the April May lows (chart above). During the coming week the trend line declining from the August/November/December highs will intersect the trend line rising from the April/May lows. This crowding or convergence of the trend lines is not some kind of magic bullet, but both have substantial technical significant importance.

To read The Daily Call you must be a subscriber (Current members sign in here. ) Start your subscription today.

Declines Ran Out of Steam (For Now?)

Weekly Continuation

The expected, July contract gave up the record premium that had been awarded over expired June. The new prompt traded just through June’s expiration low ($2.138 v $2.143) nearly on the the value of a trend line rising from the April/May lows, before recovering a few cents. In four of the last five weeks prompt gas has settled between $2.113 and $2.181 as daily and weekly trend lines steadily made their way to convergence with current price above the February/March/April/May lows ($1.967 – $1.944 – $1.946 –$ 2.031) while volatility continues to decline.

Violation of the trend line rising from the April/May lows (currently $2.144 and rising $.005/day) will suggest another test of the support presented by calendar month lows bracketing $2.00.Violation of the trend line declining from the May high (currently $2.290 and falling about $.04/day) will suggest a forthcoming test of the downtrend defining trend line drawn from the August/November/December highs (currently $2.383 and falling $.186/week). Expect July to successful test both ascending and declining short – term support and resistance.

To read The Daily Call you must be a subscriber (Current members sign in here. ) Start your subscription today.

Base Building Continues

Weekly Continuation

New prompt July ended the week at $2.417, $.236 premium to expired June. July almost always commands premium over June but $.236 is the most generous EVER awarded. The historical fact is that July almost always gives up whatever premium is awarded usually doing so during the first week of June. Candidly, there is no clue for the reason that July has been bid with historically extraordinary premium, but history tells us that July gives it up, and judging by recent history, pretty quickly.

Since the recovery from the February low, trading just below $2, and the early March failure a few ticks above $3, we have discussed the likelihood of the construction of a range between the two extremes (even though the March low was a hair lower see chart below) . During the construction of semi – enduring price ranges rallies are accompanied by when the appropriate strategy is to ignore short covering rallies and wait to buy weakness that takes the prompt to test identifiable support zones while being wary of premium.

To read The Daily Call you must be a subscriber (Current members sign in here. ) Start your subscription today.

A Breakout For the Bulls

Weekly Continuation

Fourteen of the last sixteen years prompt gas has traded through the calendar April high ($2.529 this year) during May. The remaining two Aprils (’14 and ’19) were “inside” months. Since the prompt trade remained “inside” calendar March’s extremes during April, the April low hasn’t been violated during May since ’06. With technical indicators steadily improving, a reasonable expectation was that June would trade through $2.529, and it did. On Thursday June overcame the declining moving average and conventional resistance to trade through the April high for the fifteenth time in seventeen years doing so with some pretty serious volume.

Major Support: $2.00, $1.991-$1.96, $1.795-$1.766
Minor Support: $2.50, $2.36
Major Resistance $2.543-$2.604, $2.836, $3.00, $3.536, 3.595

To read The Daily Call you must be a subscriber (Current members sign in here. ) Start your subscription today.

Some Positive Technical Developments

Weekly Continuation

Last week prompt June fell to a new contract low as it tested continuation weekly closing support between $2.035 (week ending 04/07) and $2.106 (04/14), but volume fell again, to +/- 1,600,000, close to the same as the week of the April low, indicating that the firepower to drive the prompt back through $2 was also lacking. Opening at $2.148 June traded down to $2.140, the old support level from the week ending 04/21. That early print turned out to be the low of the week, but June tried again on Friday…trading as low as$2.147, before reversing higher accompanied by the highest volume since 04/17 when the prompt traded a nearly identical range ($2.146 – $2.314 v $2.147 –$2.335). Friday’s high volume “outside” day was a positive technical event but is more symptomatic of the final throes of the construction of a low than it is predictive of a significant extension of the rally. Substantial conventional, trend line and moving average resistance.

The consistent range that has held the market for over two months, suggests that the market is trading a “base”, that will ultimately support a significant rally, while the premium that has been awarded to deferred months is steadily compressed, suggesting in the market that its indicative that “natural gas will never rally again”. This sentiment that pervades the gas market will likely be the fuel source for the upcoming rally.

To read The Daily Call you must be a subscriber (Current members sign in here. ) Start your subscription today.

Range / Consolidation Continues

Weekly Continuation

Not a significant change in perspective from last week when I wrote the following… When trade remains within the range traded during a previous period (whether days, weeks, or months) important support and resistance has been defined (as it has over the last few weeks, the longer the period the more important those levels are.  As mentioned previously, violation of either of the new extremes is usually a trigger for influential traders (speculative hedge funds) who have been and remain significantly net short the gas market. Trade through the April high (this week’s first close over the continuation 10 – week SMA as well as the 50 – day) since the week ending 12/16/22, suggests is the far more likely of the near term directional outcomes.

Last week the trade expanded the June lows into the continuation lows of previous periods before finding support. Don’t have a lot to add from a technical side other than it remains in the range environment and should be traded accordingly.

To read The Daily Call you must be a subscriber (Current members sign in here. ) Start your subscription today.

Rally Adjusts Perspective (for now)

Weekly Continuation

June fell back to test April’s final day high $2.274) before rallying through the resistance that had limited prompt gas last week and before May’s decline in expiration.  June’s recovery left it with the highest close since March 10th and notably over the continuation 10 – week SMA, for the first time since the week of the December high.  The continuation chart shows a constructive “outside” week with a close above last week’s high.  Despite the relative show of strength after May was off the board June failed just short of the high that it traded a week ago ($2.529 vs$2.543) and for a second week at resistance bracketing its February low ($2.468).  June ended the week just about where it began ($2.410 vs $2.395) but did manage a third straight higher close…the first back to back to back higher weekly closes since the first three Fridays of last July.  The zone of resistance between $2.468 – $2.543 and June’s 10 – week (currently $2.604 and declining) is likely to be a formidable barrier to extending the rally particularly given that volume fell again this week.

When trade remains within the range traded during a previous period (whether days, weeks, or months) important support and resistance has been defined (as it has over the last few weeks, the longer the period the more important those levels are.  As mentioned previously, violation of either of the new extremes is usually a trigger for influential traders (speculative hedge funds) who have been and remain significantly net short the gas market. Trade through the April high (this week’s first close over the continuation 10 – week SMA as well as the 50 – day) since the week ending 12/16/22, suggests is the far more likely of the near term directional outcomes. This will likely extend the rally toward the March recovery high ($2.674, 03/14).

To read The Daily Call you must be a subscriber (Current members sign in here. ) Start your subscription today.

Strength Continues

Weekly Continuation

Following the week ending “outside” day reversal with a close near the session’s high, two Friday’s ago, the now soon to expire prompt gapped through the still declining moving average when trading resumed last week and formed a daily continuation gap that remains open between $2.132 and$2.140 ( it has been a while that a support gap has not been filled immediately). That gap higher opening kicked off an extension of the rally, the first three day rally since the recovery from the February low. At the high point of the two weeks late February/early March rally (which also occurred on a Friday) then prompt April failed at the declining 10 – week SMA and that is exactly what the two weeks rally from the April low did ( so far). This value of the widely watched 50 – day simple moving average (the 50 – day SMA is about the same as the 10 – week, but because of holidays, not quite) on Tuesday was $2.368, the week’s high was $2.385 (which was also the low of 03/15 ). The converging conventional and moving average resistance was way too much for the prompt gas to get through on the first try, particularly given that volume was falling (Monday 545,000 (which was less than during Friday’s reversal day volume of 563,000. ), On Tuesday , the day of the high, the volume clocked 377,800, but the 20 – day SMA showed up as support. Recovery from the now flattening moving average support left the prompt higher in four of five trading days, the gap still open and with the highest weekly close of five.

The recent two week rally does not signify the end of the bear market, but it is becoming easier to see the construction of a short – term base since the middle of March on the continuation chart. Substantial downside momentum that had built during the precipitous decline from the December high seemed to be exhausted when prompt gas rallied 50+% from the February low closing not far off the month’s high, Typically, that is about as positive as price action gets after trading a very significant low with a momentum divergence.

To read The Daily Call you must be a subscriber (Current members sign in here. ) Start your subscription today.

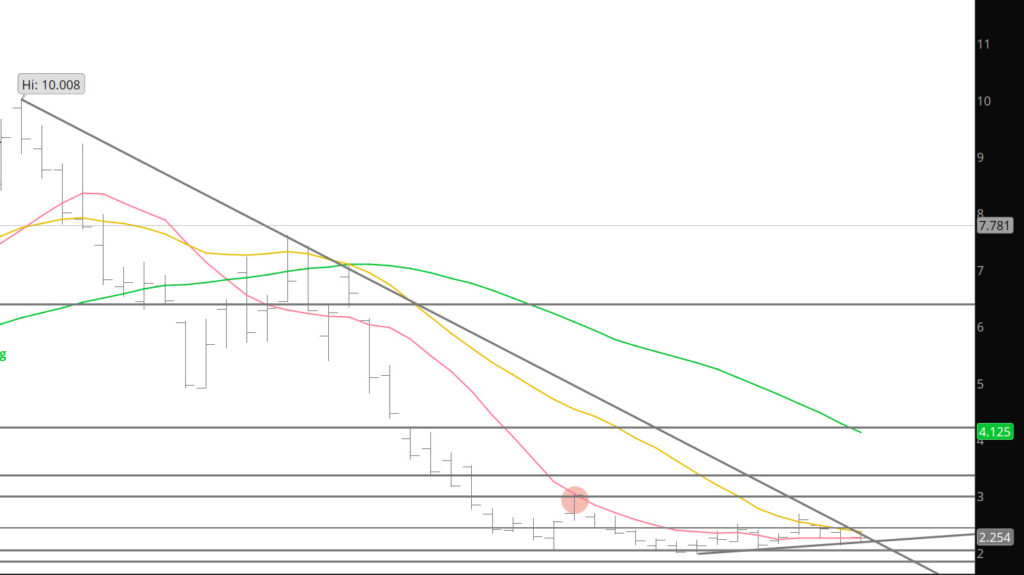
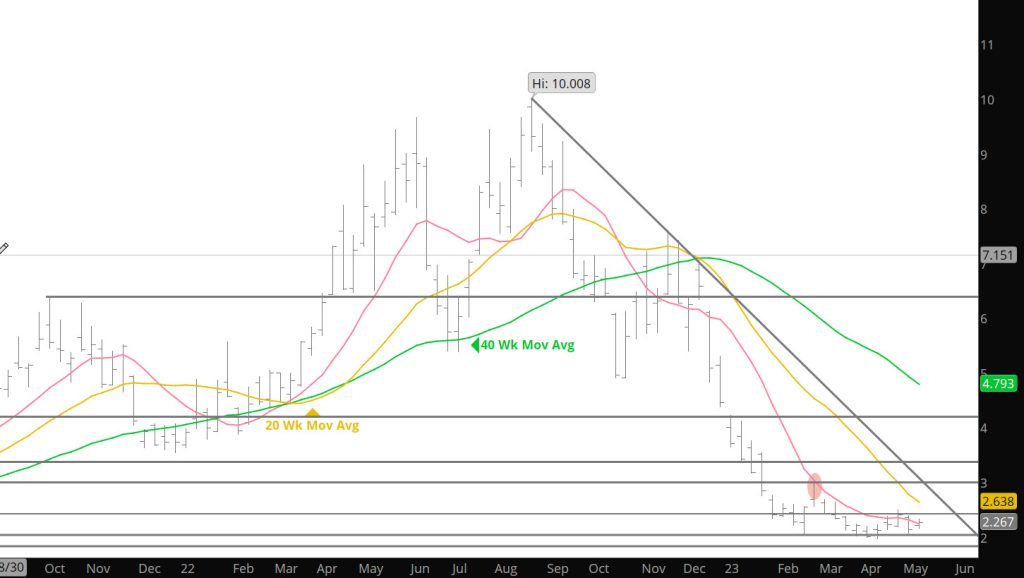
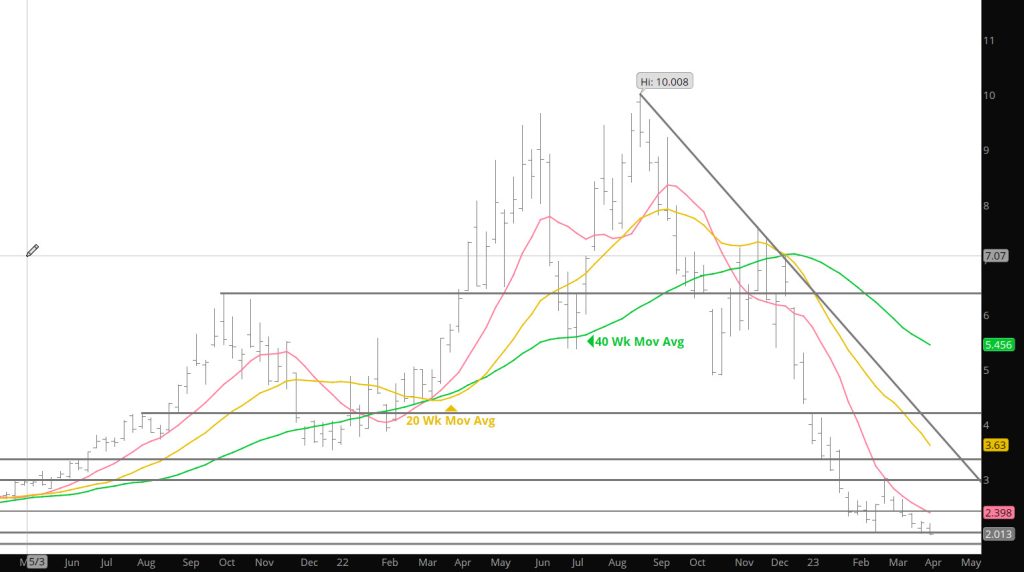
Sellers Running Thin?

Weekly Continuous

Despite an bearish outside week reversal to the downside, selling sufficient to drive the prompt through the lower extreme of the narrow zone did not materialize. The the failure to extend the decline (the low was $1.946) toward the September ’20 low ($1.795) triggered a short covering rally that left May $.103 higher for the week.  That recovery from a test of such obvious and critical, support is a pretty good indication that at least for the near term May may start to look like it is running out of sellers. Technical improvement was also evidenced by the highest volume week since last since last September. Mentioning in previous analysis that weekly volume has been on balance declining since just prior to the February low and suggesting that selling pressure has been starting to dissipate. In addition, total open interest declined 38,702 contracts–the largest one week decline in the total of contracts outstanding since the beginning of the collapse from the August high.

Last week does not “announce” a trend change but rather a potential of a shift. This market’s declines are not “over” and buying dips (on a limited scale) may turn out profitable over time. If prompt gas is able to remain “inside” the March extremes during calendar April and end the calendar month higher than it began ($2.085-which stands to be possible given a boost by June’s current premium over May ($2.305 v$2.114), aggressive sellers may start to re-evaluate their beliefs.

Major Support: $2.00, $1.991-$1.96, $1.795-$1.766
Minor Support:
Major Resistance $2.12-$2.184, $2.36, $2.836, $3.00, $3.536, 3.595

Price Action Getting Ugly

Weekly Continuous

On Good Friday (I forgot no trading) I wrote the following….Prices dropped below $2.00 and suggested closing below that important area but found some minimal support. A close below that level sill suggest additional declines will be coming. Today will provide some important indications for the May contract and bias objectives going into the historically strong summer (power demand) season. Well — there was no trading on Friday and the market remains at the Thursday close.

There are no technical indications of a positive bias entering or even attempting to enter this market (that in itself leaves me with a positive bias). While total volume has on balanced declined since mid – February, particularly since the March high, average daily volume increased significantly during a period that it typically does not (volume is historically subdued during a shortened week, this past week Thursday was the highest volume day since the 03/21 upside reversal day). Increasing volume as price falls is technically negative.

To read The Daily Call you must be a subscriber (Current members sign in here. ) Start your subscription today.