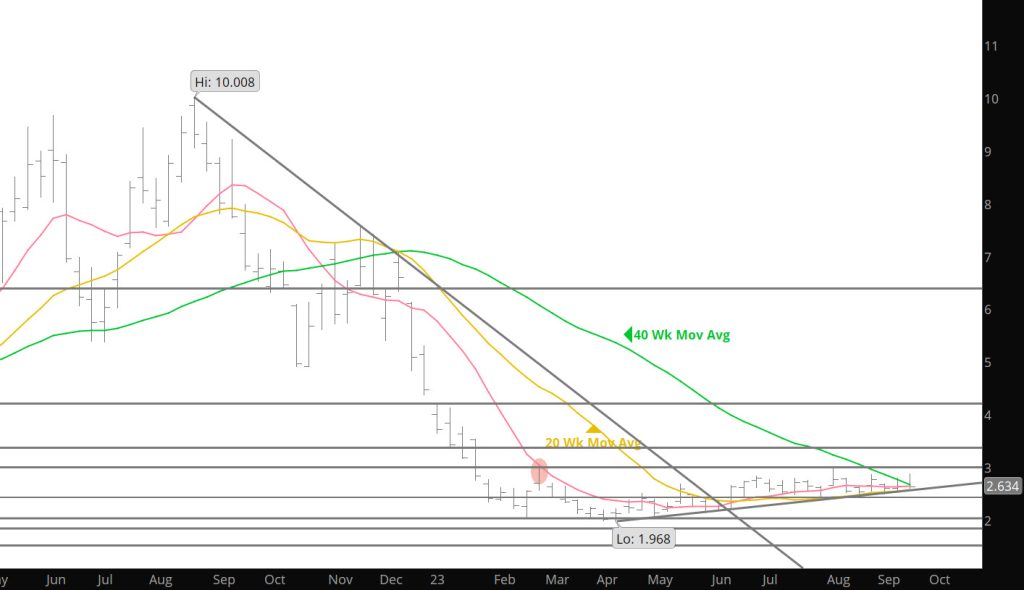
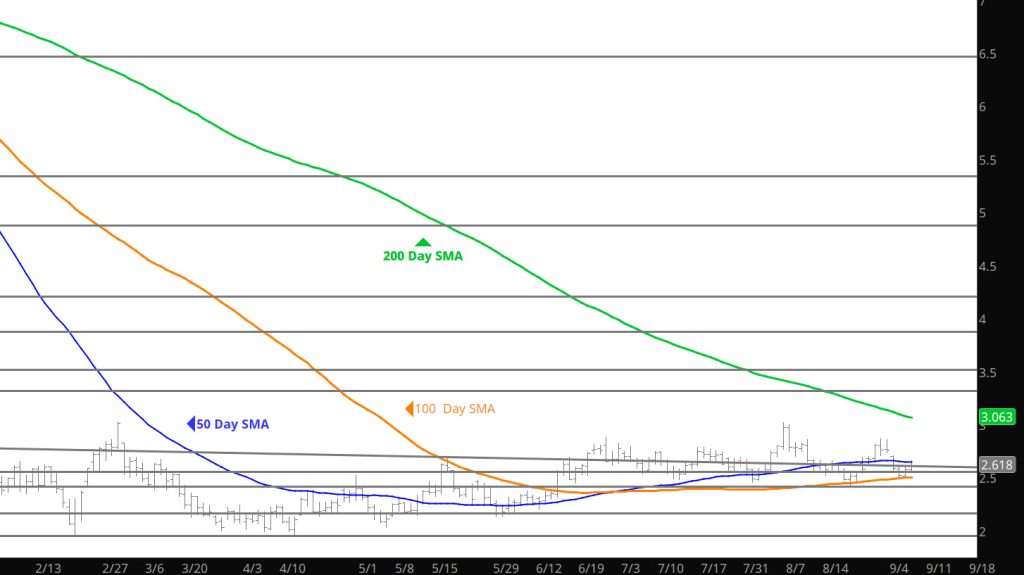
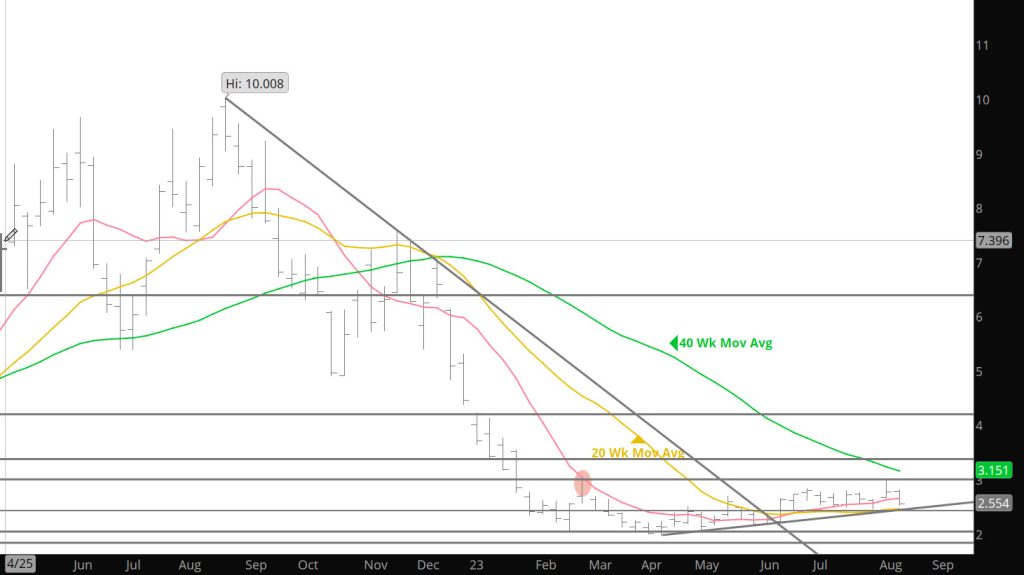
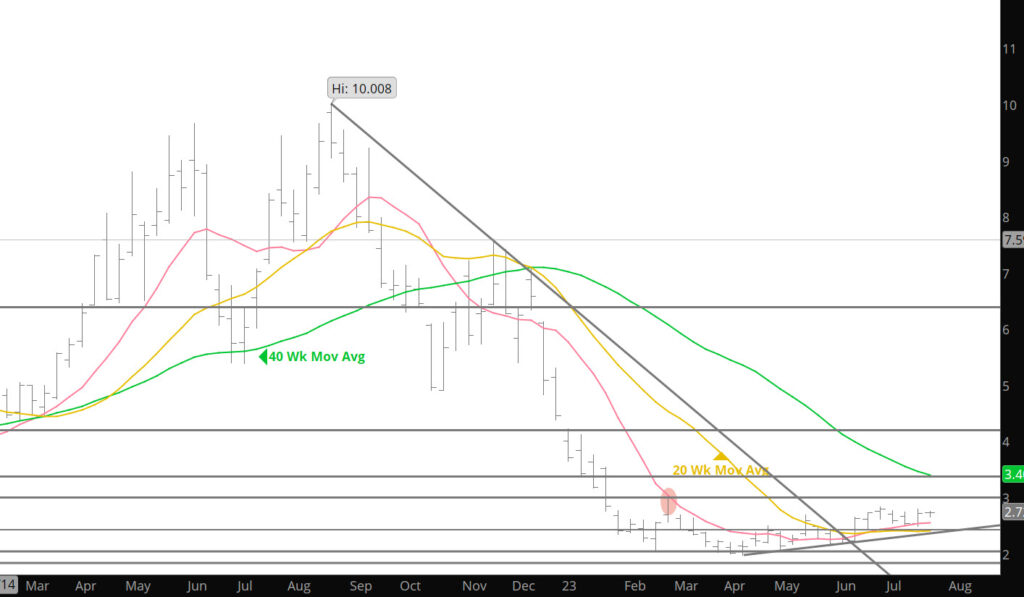
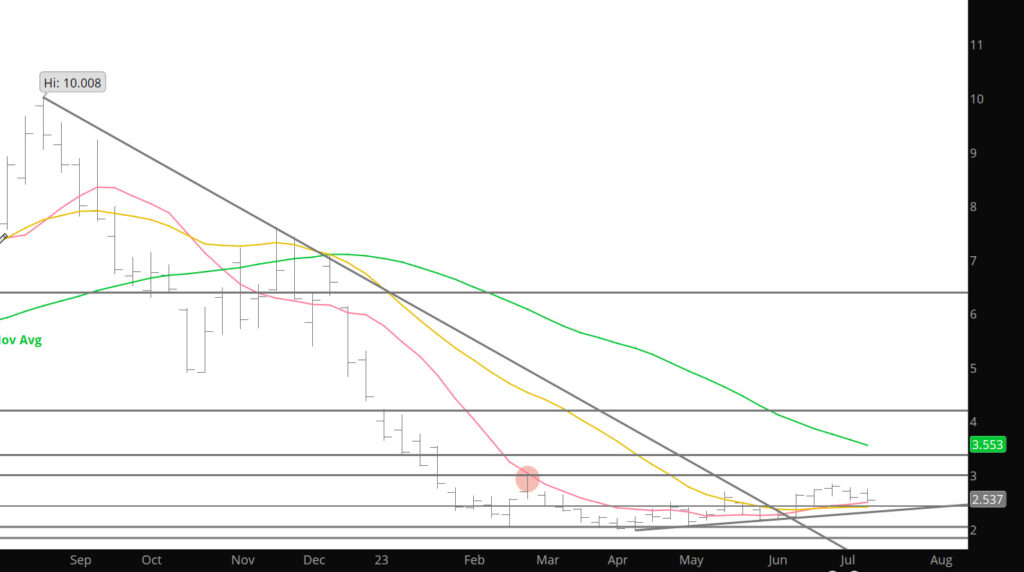
Prompt Oct remained in the same range October gas opened a little lower ($2.624 v $2.644) and closed a little lower ($2.637, minus $.007). In between there were a couple of tests of support (Monday’s low was $2.600, the value of the trend line rising from the April/May/June lows was $2.598 and another failed test of resistance. October traded an “outside” day reversal after the first test of the rising trend line with increased volume then followed through to the upside, trading a new high for its tenure as prompt ($2.872 v $2.865 on 08/31). The now soon to expire prompt managed to post a new high daily close then that was all she wrote as October gave up the two day gain falling to a new low for the week $2.595 before Friday’s recovery to close at $2.637, a little more than a penny below the continuation 50 – day SMA.
November gave up more (-$.053) as did December (- $.048) and the winter ’23 – ’24 strip (- $.041…a new low close). November has defined its own trading range since late March…+/-$2.825 – $3.300 but this week’s lowest close in 2+ years suggests that the lower boundary of that range nearly corresponds to the upper boundary of the continuation range, is likely to be in for a severe test. Have discussed the possibility/likelihood of November being taken into the extended continuation range and continues to warrant a serious mention. A close below $2.825 increases that likelihood to a probability. November is still awarded $.242/dt premium over October but since its peak on 08/15 that premium has been reduced by half ($.239 v $.502).
To read The Daily Call you must be a subscriber (Current members sign in here. )
When the week started — prices gapped lower and never came close to closing the gap during the holiday week. Discussed the historical tendencies of price action around the holiday with the declines consistent. In some years the decline is severe, some modest, the average of the last ten is about 10%. After closing at $2.765, gap-piing lower on Monday/Tuesday when trading resumed. On Thursday, after trading to the week’s low of $2.500 the prompt reversed higher from support and registered a decline of 12.7% from the 08/31 high. Given that October continued to follow the recent trend on the technical script the guidance is that the trading range will likely continue through at least the remainder of October’s tenure.
The gap left on 09/05 remains open between $2.708 and $2.735, together with a trend line drawn from the August and pre – Labor Day highs will present formidable resistance just below the aforementioned June and July highs. Expect October to close that gap and test the trend line tested over the next couple of weeks. At least as often as not the post Labor Day low turns out to be the low for calendar September and October settles premium to its immediate predecessor (about 75% of the time).
To read The Daily Call you must be a subscriber (Current members sign in here. )
Prices reversed from a new low for September’s tenure and the soon to expire prompt had a gap higher, finding similar selling at similar levels tested earlier in the month. Before September expiration (about exactly midway between the July and August settlement values) the expiring prompt closed the gap and ended with a last two day gain. New prompt October (carrying a $.121/dt premium when September settled at $2.556) the new contract month immediately built on that premium closing on the first day of its tenure at $2.806…right in the middle of the zone of resistance between the June and July highs. October tried twice more to close above that zone (trading to highs of $2.865 and $2.860) but both times ended those trading sessions lower.
The new prompt gas is following the historical technical script fairly well. As discussed prices around Labor Day have a period of weakness on either side of the holiday. The prompt gas tends to rally to a Labor Day high before weakening immediately before or immediately following the holiday period. Most often that weakness leads to a mid – September low. The average of the declines over the last ten years is about 10%.
To read The Daily Call you must be a subscriber (Current members sign in here. )
It certainly appeared that tendency was at work when September rallied to close higher for five straight days from a low of $2.457 on 08/02 up to test the March high, but there has been a different tendency during ’23, to which there has been little discussion here. The only expiring monthly contract this year that has had a semblance of a rally into expiration (a trend contrary to the trend of 2021 and 2022) was July and it lost about a quarter on its final trading day. After printing the June Q2 high on 06/28 expiring July traded an “outside” day reversal to off the board at $2.603. The others either traded the low of their tenure during the last three days before expiration (January, February, March, April, and August) or fell hard from a lower high (May $2.385 to $2.101, June $2.685 – $2.143). The last week there was too much attention to the 08/09 high volume breakout through the June/July highs. Still, despite a new low daily close ($2.486, the lowest daily continuation close since $2.485 on 06/20), trading through all those weekly lows (five between $2.457 and $2.536) and briefly through the 20 – week SMA (currently $2.471) September managed to recover enough to hold the fledgling up trend defining moving average and the trend line rising from the April – May – June lows on a daily and weekly closing basis.
Over the five Fridays of prompt September’s tenure there have been four lower weekly closes. September’s net loss since Friday 07/28 is $.167/dt September giving up its premium plus $.026 at the low daily close of its tenure. It’s not like they took September and shot it. The more interesting elements are that over those same four of five losing weeks the current one – year strip is only $.008 lower. If September is $.167 lower and the strip is only $.008 lower there must be some under the radar allowing strength to occur somewhere. As it turns out, the average of November ’23 – March ’24 is $.037 higher over the same period. Seems to me that is supporting evidence for the thesis that sponsorship for deferred and distant deferred contract months is slowly gathering. For now, there is no doubt that the trading range that confined successive prompts for all of Q2 (perhaps setting up a similar range for Q3), will continue to be the primary consideration (meaning the appropriate strategy for traders to buy weakness – sell strength). Expectations are for the October to give up whatever premium is awarded when September trades its last, but it seems reasonable to point out that every time that prompt gas has traded into the mid $2.40s since the middle of June (prompt in waiting October into the mid $2.50s) the zone on either side of $2.80 has been tested.
To read The Daily Call you must be a subscriber (Current members sign in here. )
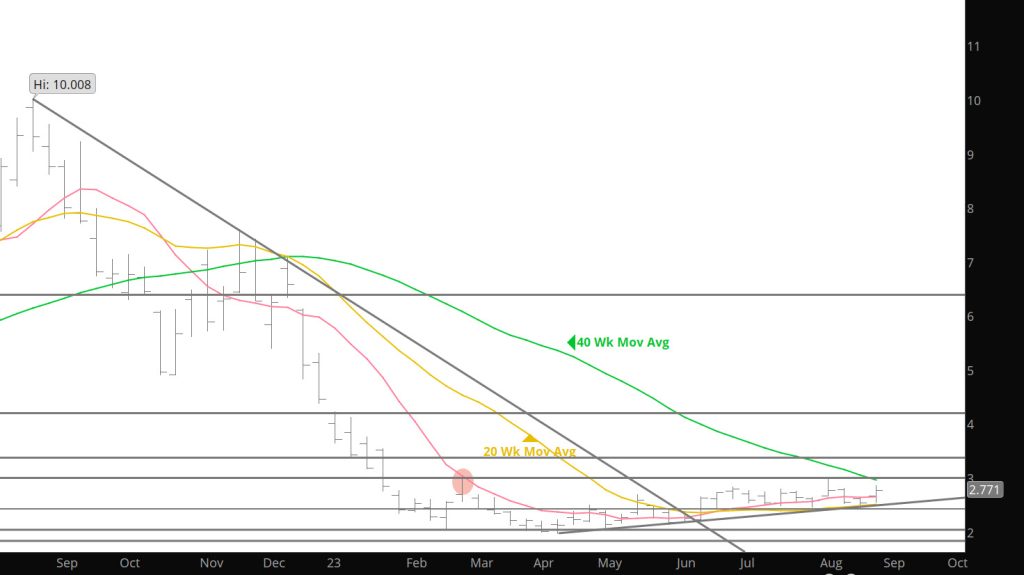
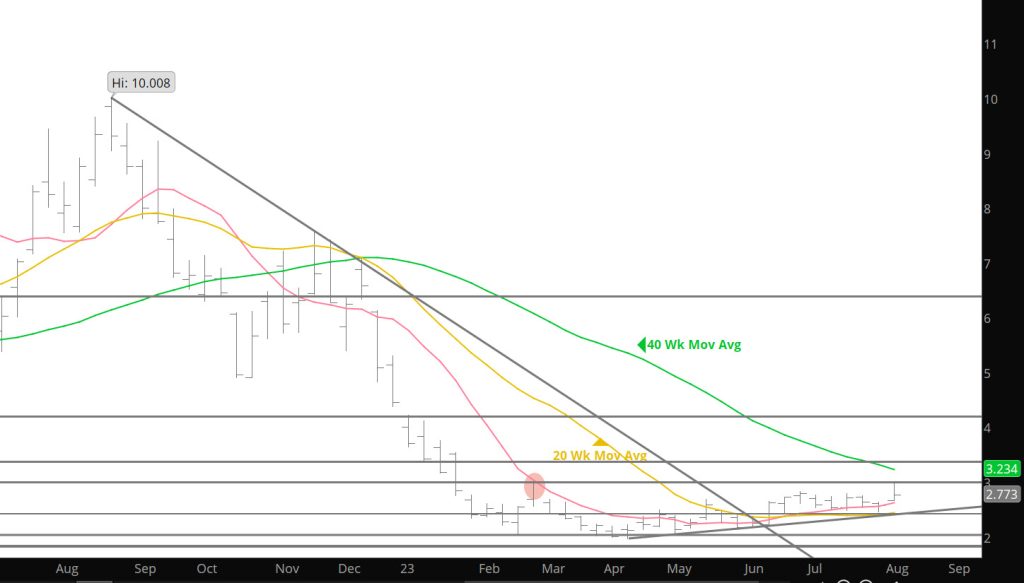
After trading just briefly back above the June high ($2.839, the previous week’s high was $2.863) September gas reversed lower, again failing to close above the zone of resistance between the June and July highs with an increase in open interest. That failure brought a decline further than anticipated but with a substantial decrease in volume. The target suggested last week was $2.60ish but that zone of defined support did not limit September’s fall as the prompt traded to a low of $2.524 before recovering to close at $2.551. Notably, the close was well above the cluster of weekly lows that traded between the end of June and the beginning of August (+/- $2.45 –$2.49) but also below last week’s low. A lower close below the previous week’s low infers additional weakness coming.
Despite modest price erosion of near term gas over the last two weeks, September closed $.026 lower than two weeks ago, but the strips are higher with winter $.136 over the last ten trading days, one – year $.092 higher. Perhaps that’s how the Q3 seasonal pressure plays out this year. The strips are much closer to earlier highs. Prompt gas traded that Q2 high on 06/28, the high daily close of the winter ’23 – ’24 was $3.613, Friday’s close was $3.612. The high daily close of the continuation one – year during the closing days of June was $3.363, Friday’s close $3.307. Maybe my analysis is way off base but seems to me those differences suggest that sponsorship is building for deferred/distant deferred contract months.
To read The Daily Call you must be a subscriber (Current members sign in here. )
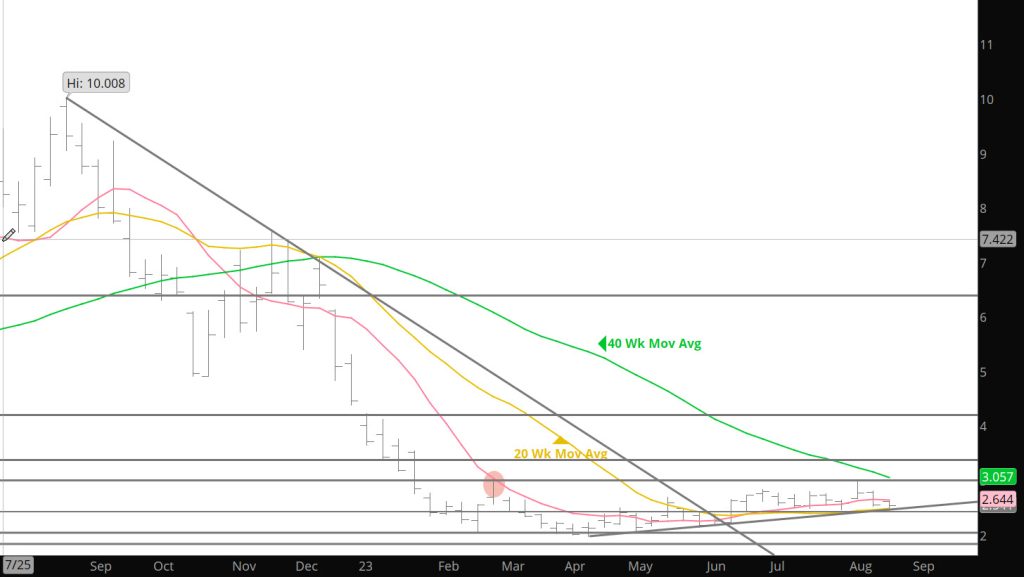
The market has prompt gas construct and remain confined within a tight trading range about a third as wide as the range constructed between the range traded during calendar March for a while. The expectations were that prompt September would remain within that range for the duration of its tenure. Then there were four straight weekly lows between$2.457 and $2.492 (and others in the neighborhood), and the tendency of September gas to trade the low of its tenure in early August, fed the bias is that prompt gas is winding up for a run later into the quarter. Well I did not see was the likelihood of a short covering event the likes of which I can’t recently recall.
Open interest (the total of contracts open in the market) has been falling since a peak of 1,389,864 on June 6th (4 days after the June low at $2.136). As written here many times, when open interest falls while price increases the presumption is that participants buying contracts to offset those previously sold short is a significant contributor to an increasing bid. Since that June low prompt gas had traded as high as $2.839 (the June Q2 high) as the liquidation of open interest remained a more or less orderly process while the weekly closing trading range between +/- $2.47 and $2.80 was constructed. That ended this past week.
To read The Daily Call you must be a subscriber (Current members sign in here. )
Last Week’s low broke slightly lower than expiration week, as September did trade a lower low ($2.457 vs $2.463 previous week. That extends the seasonal Q3 decline to 13.5% from the June Q2 high ( less than half of the ten year average for the decline) and goes into the books as a violation of the July low for the fourth straight year. The absence of any follow through after trading a lower low says something about the support that we have talked about for the last several weeks. Prompt gas hasn’t traded an “outside” August (trade through both the July low and high) since 2010 but back then it use to do it on a regular basis (’10, ’09, ’07, ’02 and ’01). Given the “recent” history trading through $2.793 (the July high) seems like a low probability event.
For the fourth straight week support above $2.450 limited any further decline. The last lower low was $2.448 on June 21st. The prompt did start out a little stronger (trading to a high of 2.693) after settling the previous week at $2.638 but quickly failed. For eight straight trading days prompt gas failed within the range of the last high volume day (July 20th) when a few more than 500,000 contracts traded. The high that day was $2.789. Trading highs within the range of a high volume day is characteristic of the continuing consolidation and construction of a trading range. The zone between the July high and the June high, $2.839, forms the upper boundary the recent range.
To read The Daily Call you must be a subscriber (Current members sign in here. )
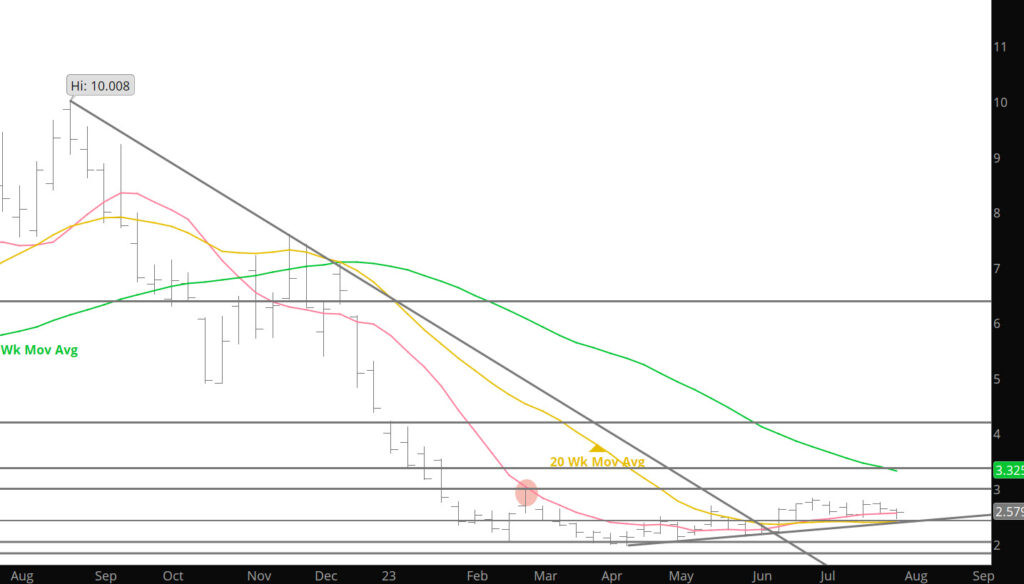
After trading another weekly high, failing at the band of resistance discussed last week, there have now been four straight weekly highs between $2.750 and $2.793, six between $2.740 and $2.839. There is clearly technical resistance in this zone and seldom as clearly defined as that. August went from premium to September in a hurry as it quickly made its way to support, also is just about as clearly defined. The lows of the last three weeks have been $2.492, $2.484 and $2.463. August went off the board exactly equal to the low two weeks ago and a little above the others ($2.492, $.111 under July and the first lower contract expiration since April settled at $1.991). discussed previously, the August contract has been described as historically amply offered. Given the way it went to expiration that again appeared to be the case. The low of its tenure as prompt printed shortly before trading in the contract ceased. Absent a high volume breakout through the resistance described above, September is likely to be subject to the same price negative Q3 seasonal pressures as its predecessor.
Long time readers know that I utilize and trust historical trends and almost always write about seasonal pressures during the summer. The weak close of August gas notwithstanding there really hasn’t been a lot of evidence of that seasonal pressure during the summer of ’23. From the 06/28 Q2 high to Thursday’s expiration July low prompt gas fell $.376 or 13% vs a ten year average decline of 27%. There is a long time left in the calendar quarter, but the historical fact is that September gas tends to trade the low for its tenure as prompt in early August. Over the last seven years (since 2016) that low has traded between the first and sixth trading days of the month five times (’17, ’18, ’19, ’20 and ’22), on the tenth trading day once (’16) and on the fourteenth once (’21). September contracts have settled from $.073 (’18) to $.725 (’20) higher than August in all but one of those years (-$ .008 in ’17). The takeaway from that is that while it has not always been so, in recent years seasonal pressure has been more likely to be in evidence in July and September.
To read The Daily Call you must be a subscriber (Current members sign in here. )
Did not send out a Weekly analysis on Sunday so I wanted to share comments from the weekend charts (even though they are current for this week). In last week’s items there was a discussion of a very significant zone of support between +/- $2.330 and $2.450. Analysis strongly suggested that August gas would be “drawn” into that zone before rallying. When trading resumed, August was offered below lthe previous week’s low and expecting that the triggers for additional selling within that zone would be hit. It did not happen. Following a low print of $2.484 August reversed course and ultimate traded through last week’s high (forming an “outside” week reversal higher) and did that with increasing volume. Perennially amply offered August (although it certainly wasn’t last year) closed higher for the first time in four weeks. Prompt August has redefined support with back to back weekly lows of $2.484 and $2.492 ( four of the last five weeks between $2.448 and $2.536; resistance with consecutive weekly highs of $2.793, $2.750 and $2.789–with four of the last five weeks between $2.740 and $2.83.
To read The Daily Call you must be a subscriber (Current members sign in here. )
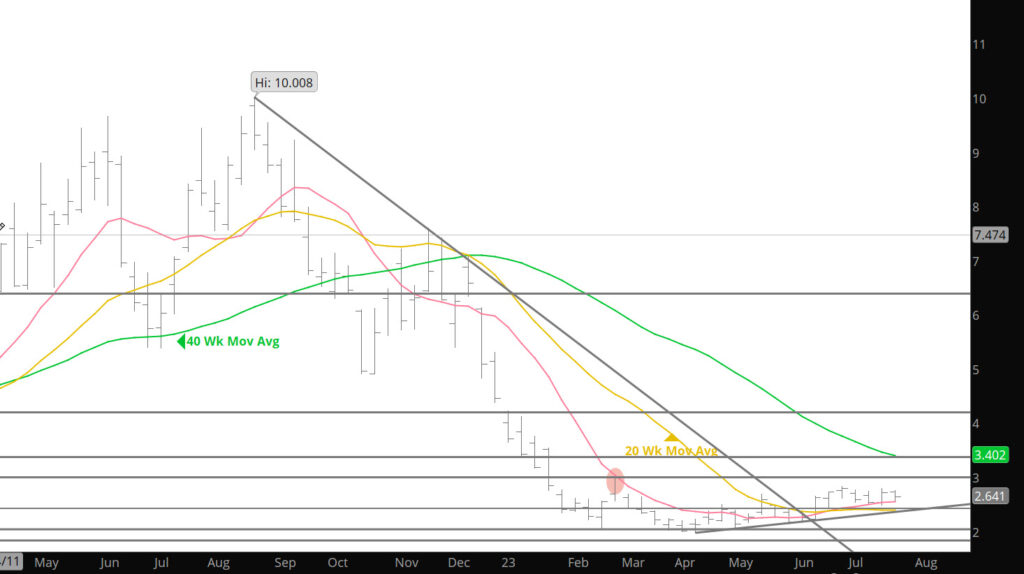
The two day rally failed at the start of the week fell a little short of last week’s high ($2.750 v $2.793), which was lower than the previous week’s high and the rally gains were quickly forfeited. With volume increasing the prompt tested last week’s low but held just above $2.536 ($2.539)…lower trade for a third straight day validated last week’s ideas of lower trade as the post – Independence Day decline was extended to $2.492.
The historically consistent seasonal decline from a late June high (measuring from the 06/20 recovery high of new prompt August), was extended to $.336 or just about 12%. That is a little more than the three and five years average declines, a little less than the average of the last ten years. While the memory of last year’s rocket ride from the post – Independence Day low (from an 07/05 low of $5.325 August ’22 rallied to a 07/26 high of $9.752) is still fresh, the recent price action is more typical of July trade. Declines should be extended a little further before sufficient sponsorship is uncovered to lift August to a somewhat higher expiration. History suggests that over the years August has settled lower than July far more often than not, but August has been higher in each of the last three.
To read The Daily Call you must be a subscriber (Current members sign in here. )