The Bias Change Confirmed

Weekly Continuous

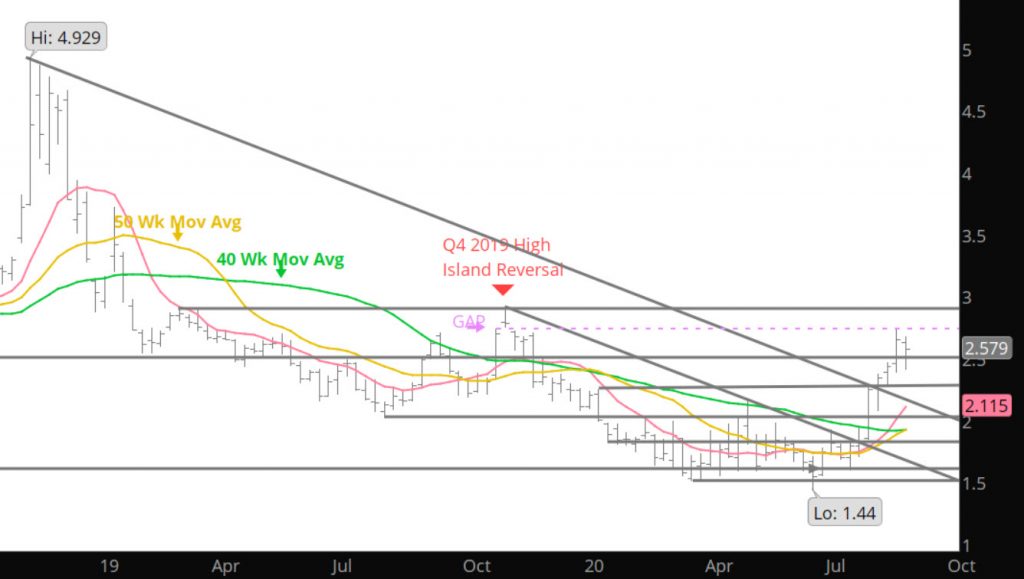
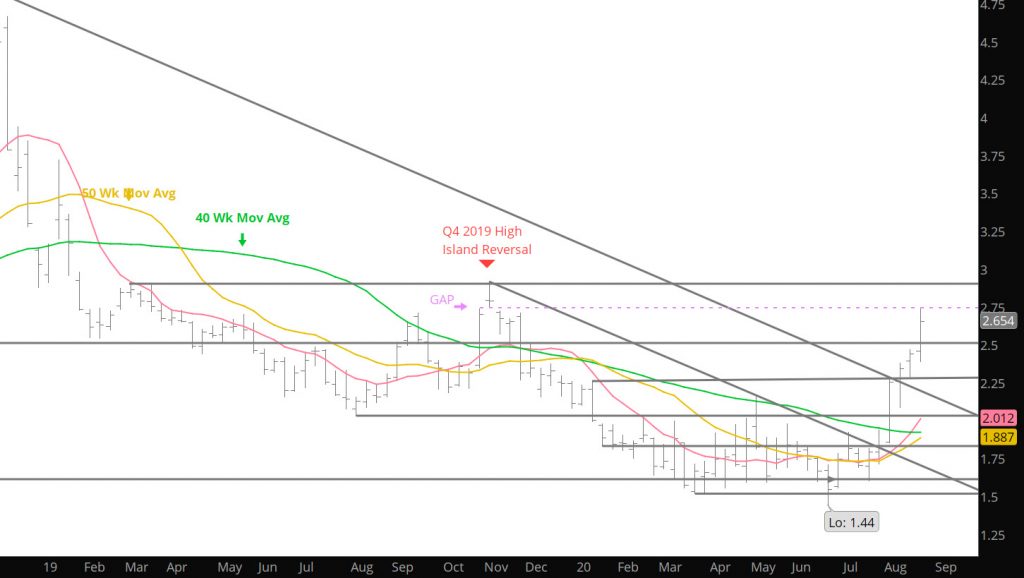
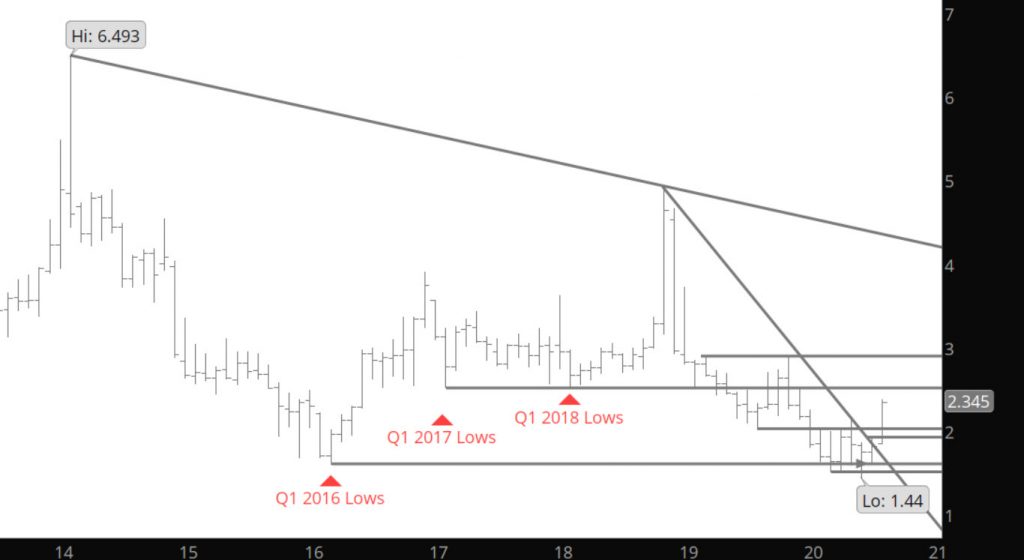
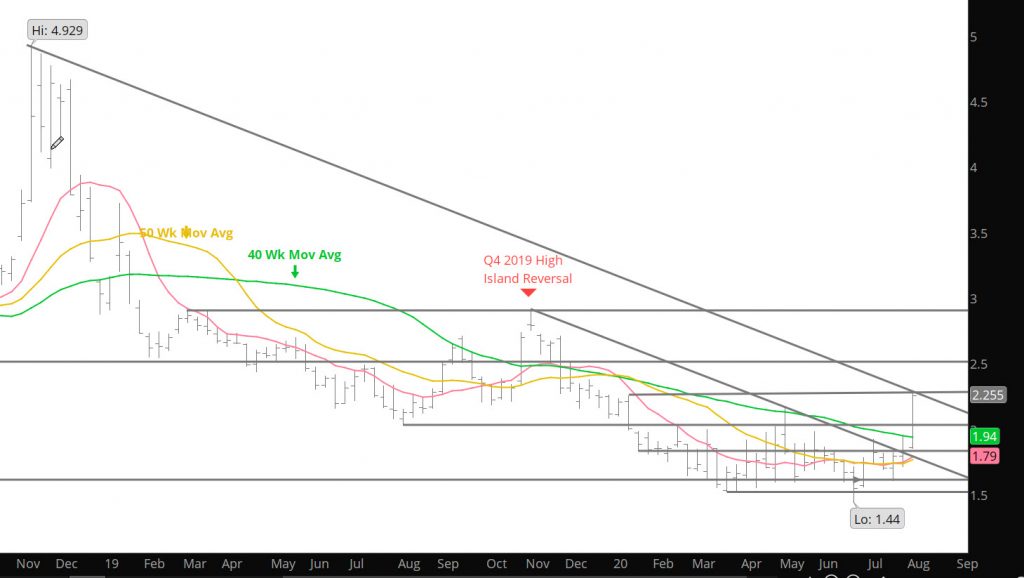
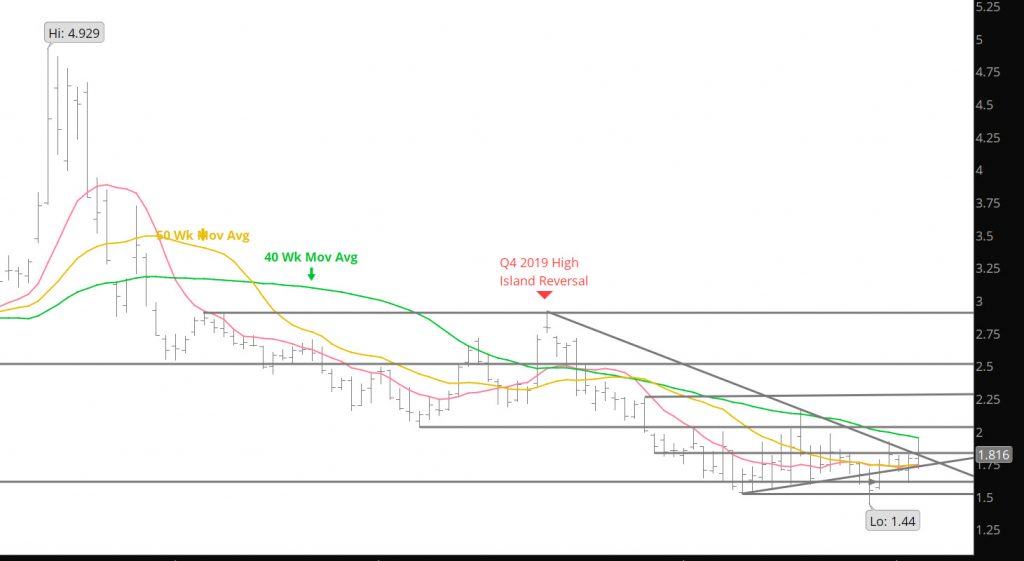
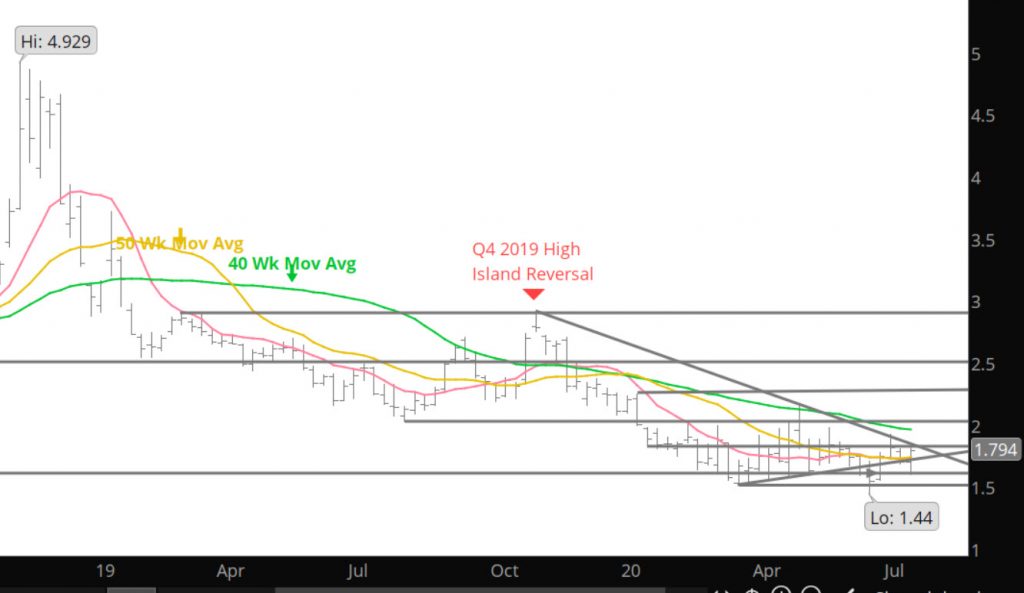
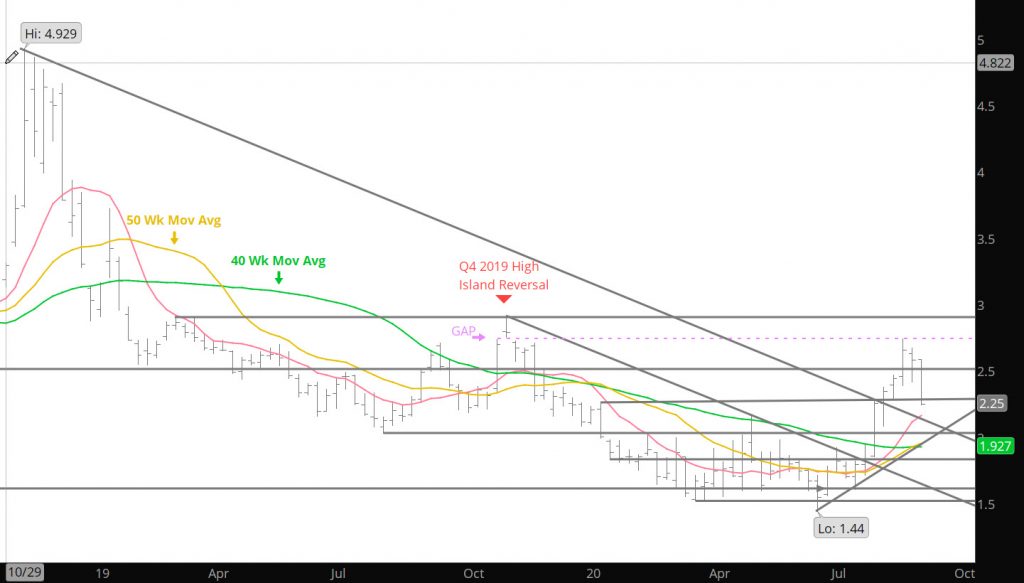
Mentioned in last week’s blog, a key for near term bias change was a weekly close above the trend line off of the Nov ’19 highs and the May ’20 highs. The market opened above that trend line, then advanced through the resistance associated with the 40 Week SMA (had only closed above that during the Q4 rally 4 times and had not closed above since Feb ’19), and some of the shorts were forced to cover. The CFTC trader’s report noted that the shorts covered 45,839 positions through Tuesday of last week. I would submit that the majority of those occurred on Monday and Tuesday.

Monthly Continuous

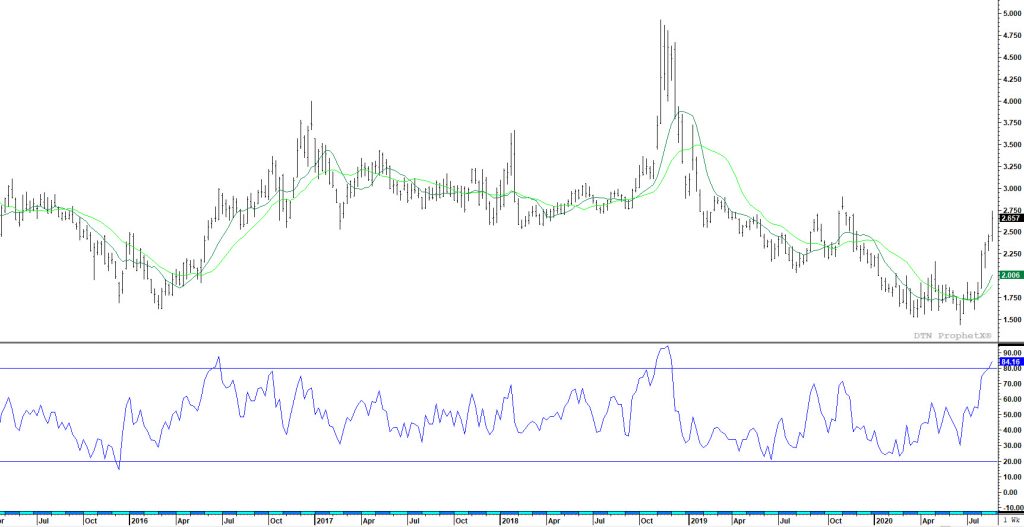
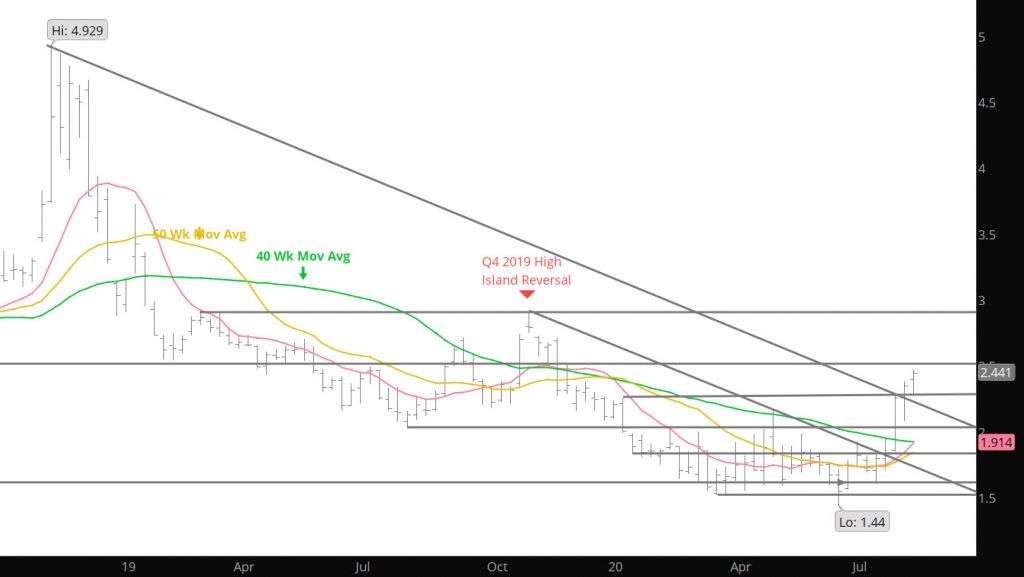
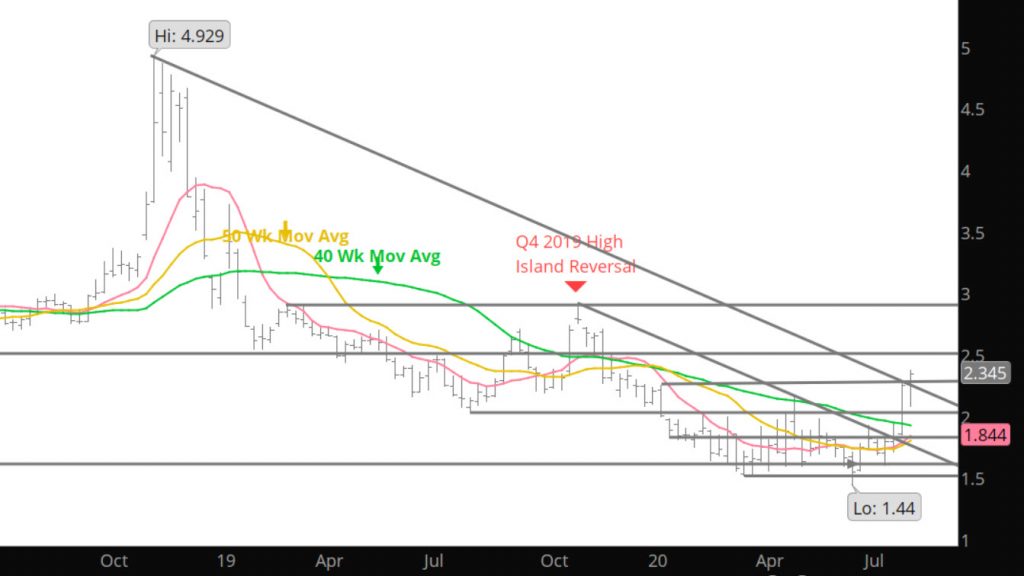
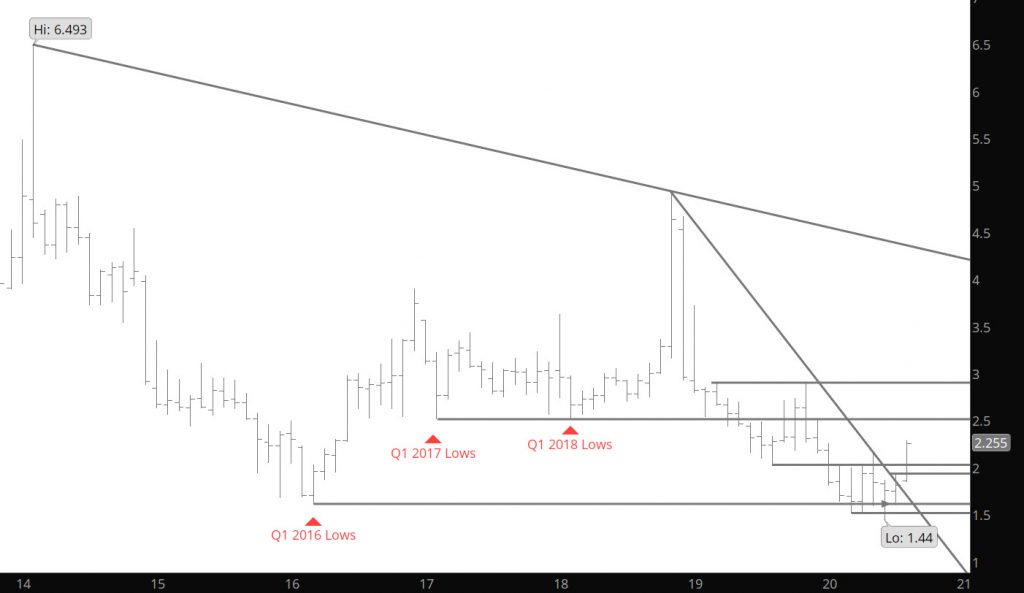
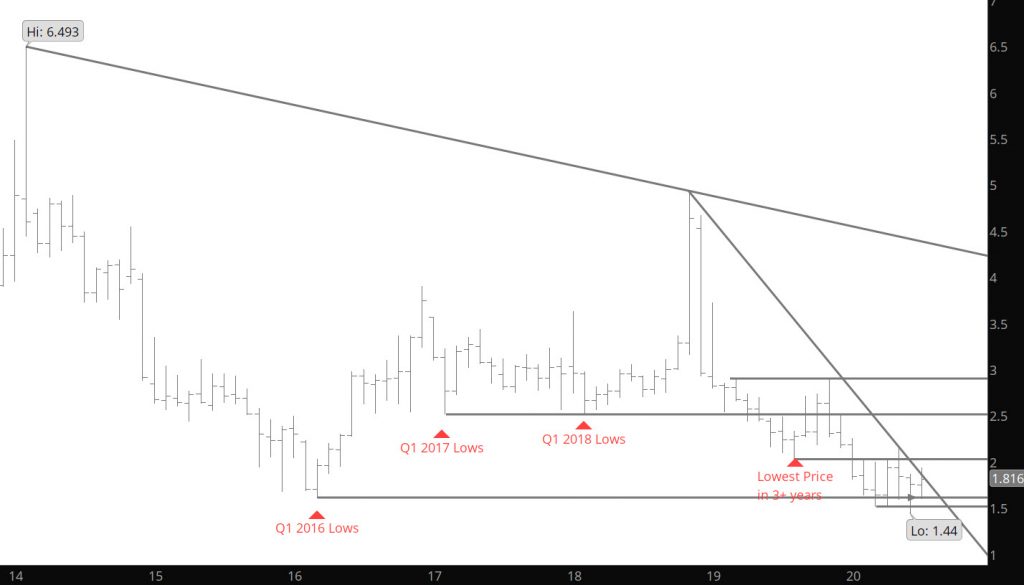
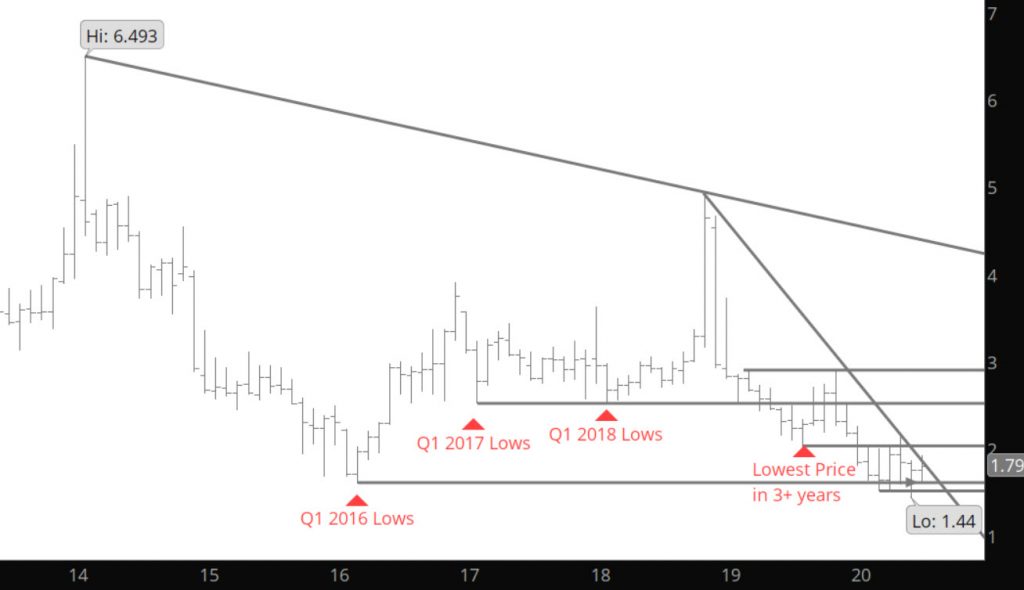
Prices then extended the gains, breaking the monthly trend line and formed the highest monthly price in seven months. These events left the market over extended to the upside, with the Weekly trading 3 standard deviations over the 20 Week SMA with the RSI momentum indicator racing to the extreme over bought level. This was achieved on high (but not exceptional) weekly volume and declining open interest (fueled by short covering). It should be stated, again on this website, that rallies based solely on short covering are not long for this world. We saw that last winter and again in May when the shorts stopped the action, prices retraced quickly. Due to this history, this analyst was startled that the bias remained positive for the rest of the week’s trade.

To read The Daily Call you must be a subscriber (Current members sign in here. ) Start your subscription today.

September Fall Back Into the Range

Weekly Continuation
Monthly Continuation

Prices traded back to 1.714 before the expiring August prompt rallying to nearly early July high (1.893 v 1.924) but then fell to expire at 1.854. From there the September contract immediately opened with a gap only to trade slightly above the August, in July, (1.928 v 1.924) failing and gave back the premium it was afforded, trading back into the common range that has held the market for recent months. It ended the outcry session nearly where the August had begun it (1.799 v 1.796). The reversal may indicate the difficulty that the September contract will face in breaking out.

It was interesting that the contract ended the outcry below the trend line on the Weekly, only to bounce before the close of the week, closed nearly on the trend line. Until the prompt gas closes the week above that trend line (from the Nov ’19 high and the May ’20 high), supported by higher volume and gaining open interest, it is likely that prices will remain in this range.

To read The Daily Call you must be a subscriber (Current members sign in here. ) Start your subscription today.

Shifting a Bias –Perhaps

Weekly Continuation
Monthly Continuation

Further evidence occurred last week with gas that there may be a gradual bias shift headed in the near future. Prices opened the week lower and formed a higher low than June’s only to reverse and trade higher for four consecutive days. The rally briefly trade above the previous week’s high but closed the week just above the previous week for a classic outside week reversal. This action was accompanied with higher volume and gains in open interest for the week — both technically supportive indicators.

Momentum indicators are starting to provide a bullish “divergence” for gas as they never confirmed the June low (July expiration) and it is looking like the August expiration will unlikely follow the similar pattern as July’s expiration.

To read The Daily Call you must be a subscriber (Current members sign in here. ) Start your subscription today.

Quiet Week

Weekly Continuous

Can’t imagine a more neutral week with neither the testing of support nor resistance occurring during trade — boring. Natural gas has provided me many “huh” moments over trading in the last 25 years and I can’t shake the feeling that I am headed into another one. Quiet trade– volume decreased over the week (WoW), open interest decreased over the week– nobody is playing in the pit which scares the daylights out of me. Speculative trade lowered positions through the 14th by 5,786 contracts, while speculative length added 9,529 contracts. Perhaps I am just a cynic, but something is brewing in the gas market- just don’t know what nor when.

Major Support: $1.484-$1.44, $1.336
Minor Support: $1.527, $1.66, $1.722
Major Resistance: $ $1.864-$1.896
Minor Resistance:

To read The Daily Call you must be a subscriber (Current members sign in here. ) Start your subscription today.

Post Destructive Expiration – Prices Find Support

Weekly Continuation

Prices closed the Holiday shortened weak on minor strength and nearly on the 50 week SMA and the 10 week SMA. All in all, prices managed to firm after the technical destruction from the July expiration. We are back into the common range that the market has found such comfort for the last few months. Seasonal history tell us to expect more weakness in the coming weeks as the Q3 is notorious for setting a low (usually around the Labor Day period), but this year seasonal highs and lows have not favored historical norm and we can’t rule out the lows of July expiration being the Q3 lows. Tread cautiously in the coming weeks.

Monthly Continuous

Major Support: $1.484-$1.44, $1.336
Minor Support: $1.527, $1.66
Major Resistance: $1.723, $1.864-$1.896
Minor Resistance:$1.759

To read The Daily Call you must be a subscriber (Current members sign in here. ) Start your subscription today.

Can It Look More Bearish?

Weekly Continuous

I through out the comment on options expiration (Thursday Daily) that those that had sold the puts at long term support ($1.50) should not be comfortable. It turned out that they were forced to cover positions during the process. Prices continued further but the damage had been done.

Now we face the new prompt (August) and expect the premium afforded the Aug contract to be challenged. That being said, we discussed the Bollinger study recently and last week’s close was THREE standard deviations below the 20 week SMA. While the weekly RSI is not in extreme territory– it could be setting up for a popular bullish divergence (a counter trend indicator)– time will tell.

To read The Daily Call you must be a subscriber (Current members sign in here. ) Start your subscription today.

Weakness Continues with July Prompt

Weekly Continuous

First off– We are in the midst of moving the office to another location which will require interruptions of internet access. I will try to get updates on the Daily out in a timely matter but there may be some issues with getting them in the email. Should you not get the email, turn to the website for the Daily. We experienced some slight problems last week but believe we had them rectified.

The next comment is “who cares about natgas”. If you didn’t get the last two Daily’s you didn’t miss much as the July contract reversed its historical trend of showing a brief rally in the middle of June only to break down and press the lows just below $1.60. Shockingly, that test failed and prices found the footing to rise on Thursday and Friday. Since the May high of July gas has traded a lower high for the sixth week consecutively, but still remains in the overall range discussed here at great length. With expiration coming up late this week, I am not convinced that July will be extending to far to the strong support surrounding $1.55-$1.51. If it could not garner the selling that after closing at $1.614, not sure, from a technical perspective, what will flip the minds of traders this week. Expect the expiration process to develop a range between $1.60 and $1.80 during the week and end in the vicinity of June’s expiration of $1.722.

To read The Daily Call you must be a subscriber (Current members sign in here. ) Start your subscription today.

Another Weak Weekly Close

Weekly Continuous

Some interesting developments in the trade this spring. 1) as a contract expires there is a substantial premium afforded to the upcoming prompt. This premiums sets the stage for a high before the weakness and selling smacks the prompt back into the range (discussed here and the Daily) that has held the market for months. 2) declines have taken the market into range and has created a complacency to the trade (note the Bollinger Band study below).

2 Standard Deviation around the 20 Week SMA — Bollinger Study

When this complacency (lack of volatility) occurs in the market- I is not likely to last for very long and creates an environment inducing potential volatility. The difference between the high 2 standard deviation band the lower band is under $.37. It is unlikely that this will hold for very long and the markets premium afforded to the upcoming months and winter will all pressure a resolution to the complacency. Should prices break down and the premiums afforded to the differed contracts come down- the lower band will be broken ($1.579 this week) and volatility is likely to increase. Should prices break above the high band ($1.945 currently), this will likely add significant volatility. Prices have not brought any indications of which scenario will occur — hence the complacency.

To read The Daily Call you must be a subscriber (Current members sign in here. ) Start your subscription today.

Prompt July Breaks Down

Weekly Continuation
Spot July Contract

Trade in the July prompt contract last week broke down and through the previous lows established in March, similar to the action in the May and June contracts when they became prompt. Last week’s breakdown was immediately supported back up to previous resistance at $1.86 before decline into the weekly close. The July trade is met with weakness early as the prompt month (usually either side of Memorial Day) consolidates finding its footing for a rally in the middle of the month (usually between the 14th and 20th), but rarely extends it’s mid – June rally into expiration (the last time was in ‘16 before that in ‘12). 

While the prompt is showing weakness, the continuation of prices remains in the recent range between $1.70 and $1.90 and last week stayed within the high and lows of the previous week. It did break below the trend line from the May daily lows, which suggests additional declines early this week (see Daily). Monthly volume declined in May for the second straight month, suggesting a lack of enthusiasm for dramatic lower prices. The lack of volatility is beginning catch my attention but remains neutral.

To read The Daily Call you must be a subscriber (Current members sign in here. ) Start your subscription today.

Market May Be Showing Signs of Bias Change

Weekly Continuous
Monthly Continuous

Looking at the charts over the weekend and found some interesting trends that have been developing since the lows were printed in the middle of March and retested at the end of March. Notice on the Weekly chart above, the market has now performed three (if you include last week’s mild run) distinct rallies only to succumb to selling pressures. These selling pressures have taken prices down but the lows from each decline has had a higher low. If you look at the trade action before the March low, any rally was pounded and developed a lower low after the failure of the rally since the Q4 high on the chart.

A similar trend is seen on the Monthly chart (albeit for only two months), with the May low staying above the April low. This subtle trend change does not eliminate the potential for additional declines, but rather is a subtle indication by the participants that interest in extending beyond the March, lows seemingly runs out of steam.

To read The Daily Call you must be a subscriber (Current members sign in here. ) Start your subscription today.