Poised and Patient

Weekly Continuation

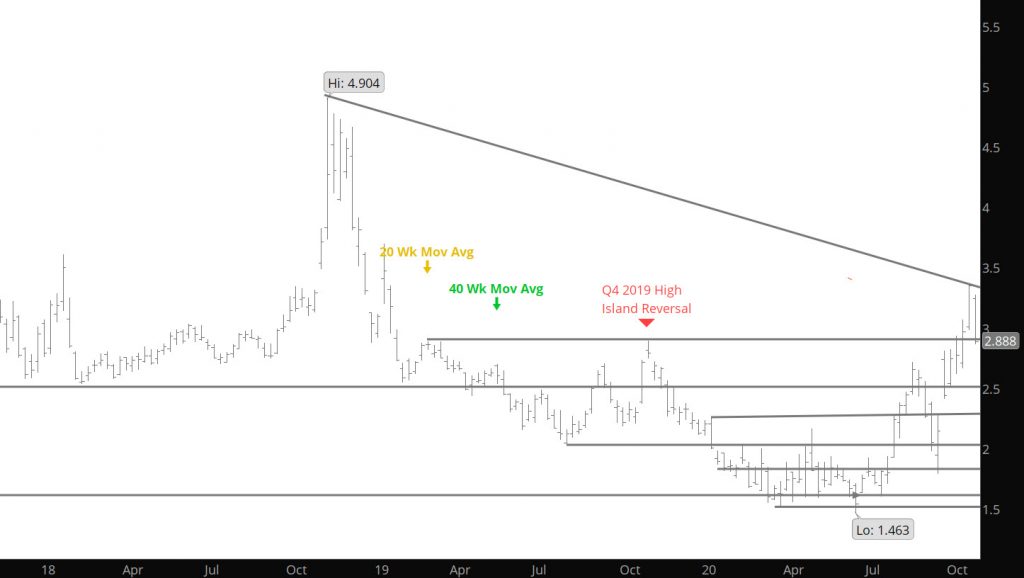
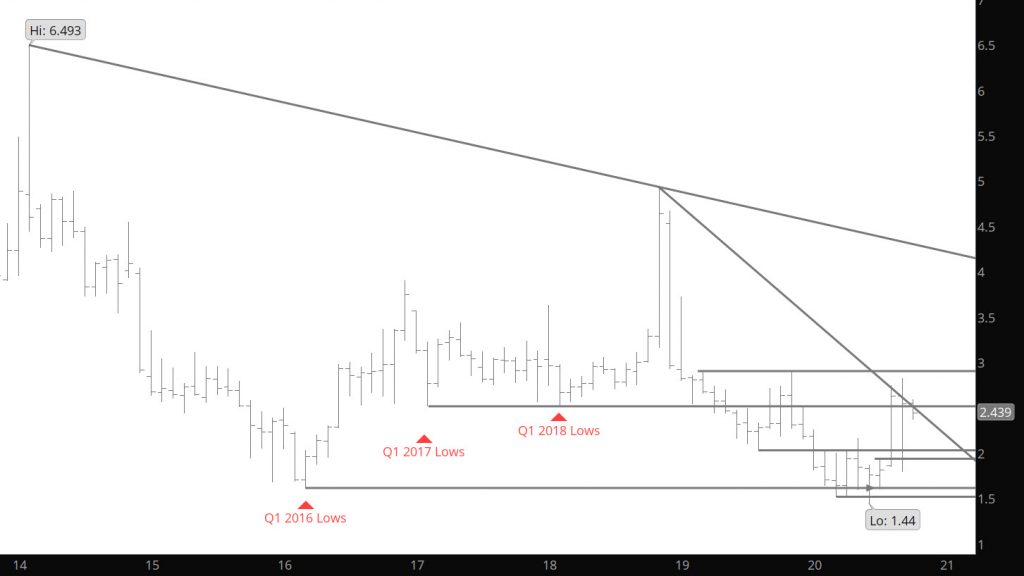
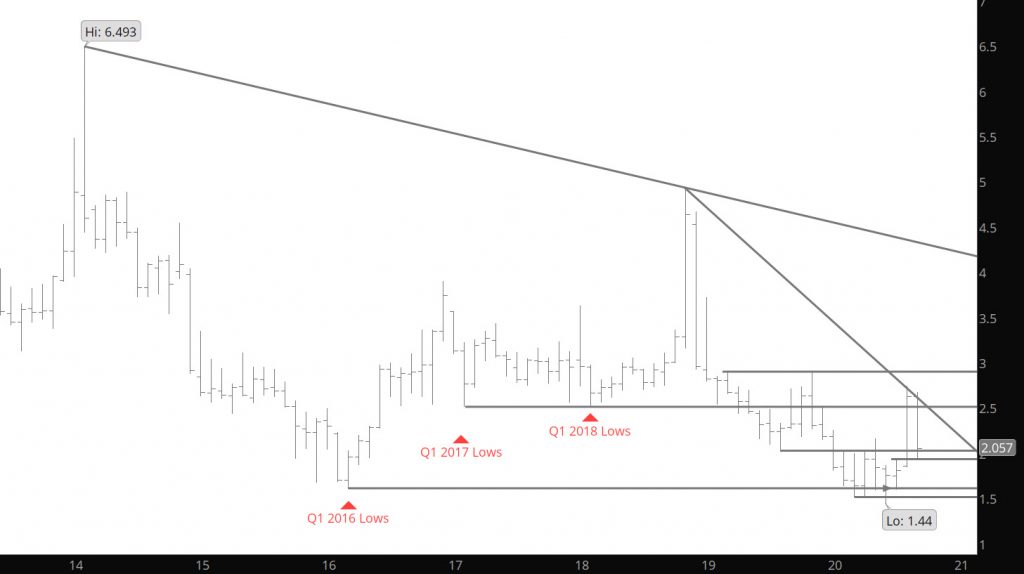
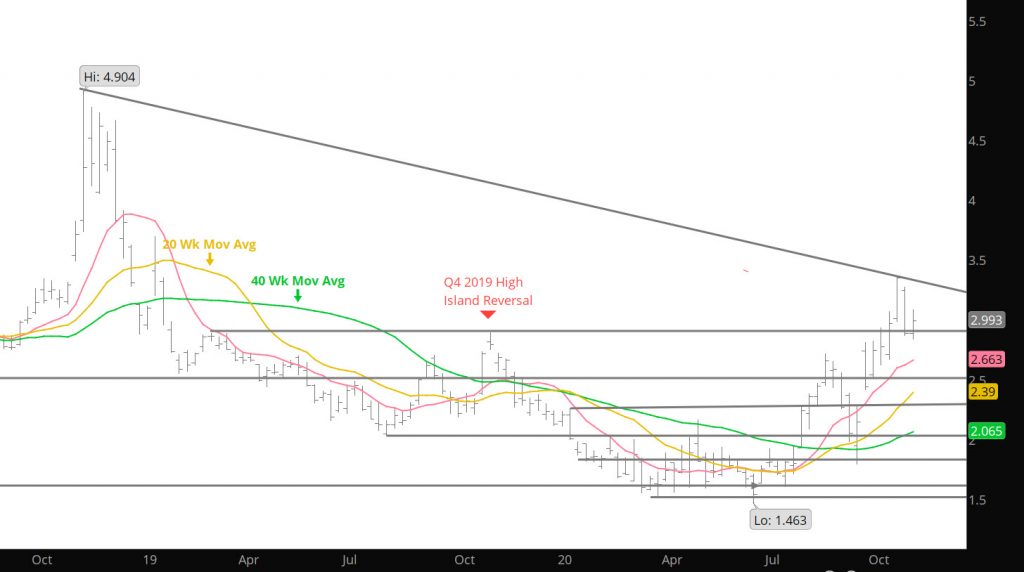
Prices consolidated last week, expanding the lower side of the recent range, but staying well below the highs of the previous weeks, which contain the expiration premium. The market seems to be waiting for the next catalyst as the weather forecasts have remained bearish (so I have been told every day by the bears) yet prices have not capitulated, so there has to be other influences on the traders.

Last week’s action provided some bullish divergences as the price closed the week higher on higher volume and slight gains in open interest which are supportive to the longer term trade. The CFTC report is not published until later today and will update appropriately.

To read The Daily Call you must be a subscriber (Current members sign in here. )

Break Down

Weekly Continuation

How much more bearish can it get — weekly reversal — blows through support $3.00 and continues to decline. This is likely headed to the 200 day in the Dec chart ($2.853) and then beyond to the Sept high at $2.823.

Total volume last week was higher slightly than the previous week when December traded near $3.40 The previous week was the least volume of any week since mid – July (the third lowest weekly volume this year) when prompt gas was still in a range below $2.00. Higher highs on declining volume is a warning that has characterized numerous significant highs in the past.

To read The Daily Call you must be a subscriber (Current members sign in here. )

Bullish Close to the Week
Weekly Continuous

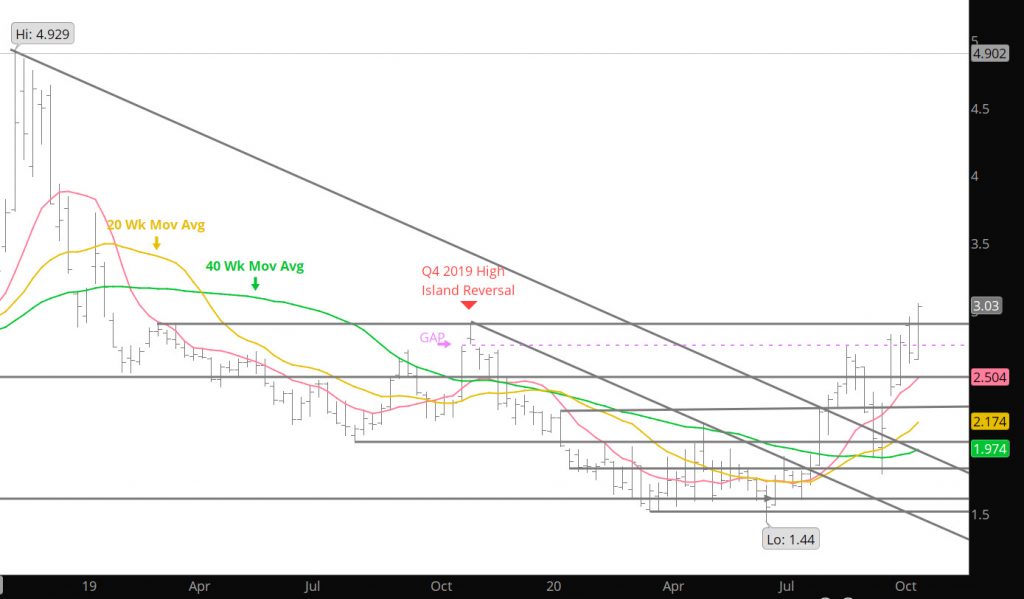
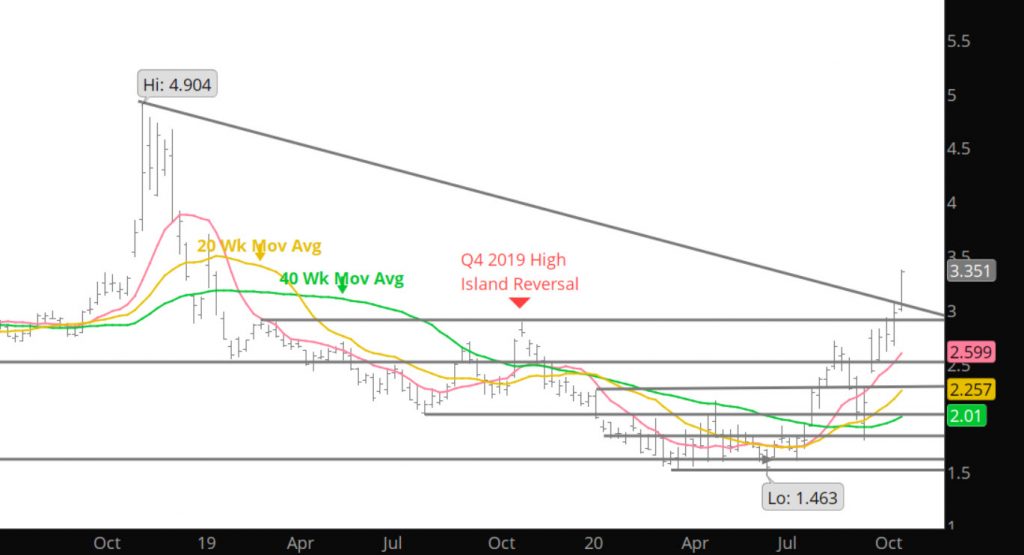
Prices closed at the highs of the week after trying to close the gap remaining from the premium that was afforded the December contract. This creates the second gap remaining in the Daily charts from the expiration premium (see chart below – highlighted by the dotted red lines). December traded as low as 3.151, narrowing the gap to a dime, before the highest volume day of the week indicated sufficient interest that the new prompt closed higher for the day extending the rally through its September high (3.362) in the after market trade.

These areas will provide support to the market in any extended declines. A confirmed close below the December expiration gap will assure a test of what is now long term support from the key area from the November contract between $2.98-$3.05.

To read The Daily Call you must be a subscriber (Current members sign in here. )

Expectations Being Met
Weekly Continuation

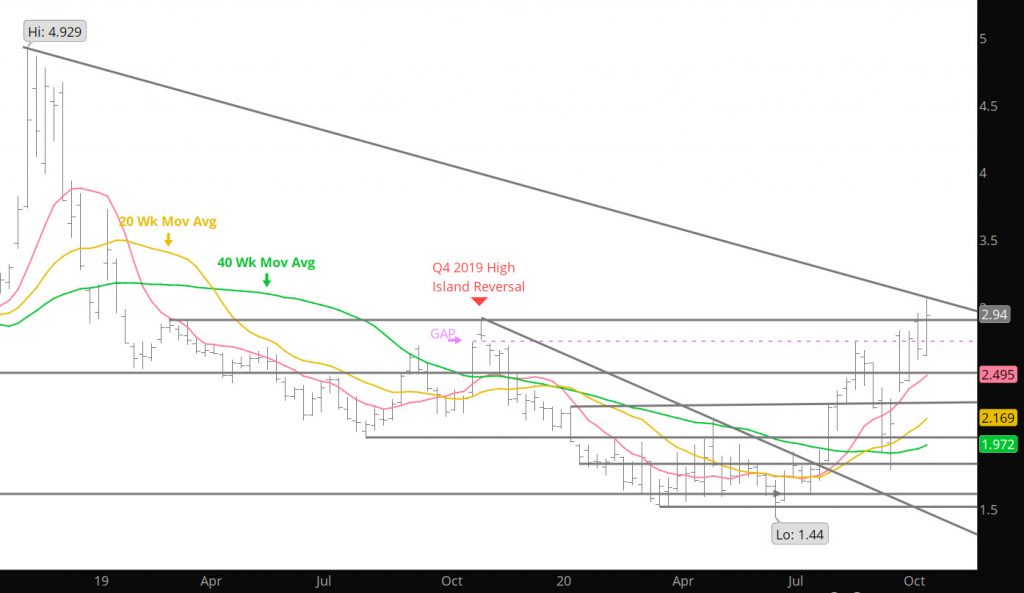
As discussed in the Daily and the Mid Week updates, closing that gap from ’19 was important and unexpected during the Nov tenure as prompt. Had a stronger indication that the gap would be traded above when the Dec contract takes over this coming Thursday (thereby gaping above the old gap), followed by the Dec prompt retracing and actually filling the gap. All of those expectations were thrown out as Nov closed gap on a Daily basis, but could not confirm the legitimacy of the strength buy closing the week above the gap. Instead, prices weakened and closed the week below the gap area (seen below).

The Gap in Daily Continuous – Back to 2019

Technical behavior interprets higher weekly closes and breakouts through well – defined resistance (held the market since 2019) are bullish indications that a market intends to continue higher. Unfortunately, the breakout to a new high was not supported in the immediate or differed contracts, November was the only contract of the next nine to record a weekly gain. A highlighted earlier, technical orthodoxy requires confirmation, perhaps it runs a little more during the three expiration, but I would expect December to continue to weaken as highlighted last week. 

To read The Daily Call you must be a subscriber (Current members sign in here. )

Gap in Daily Closes – Meaning
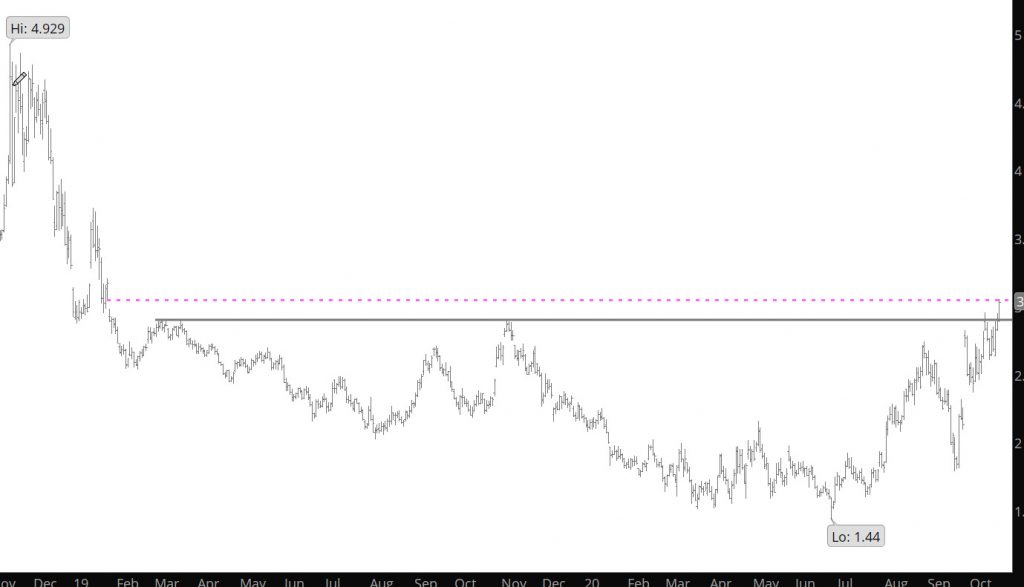
2 Year Daily Continuation
Weekly Continuation

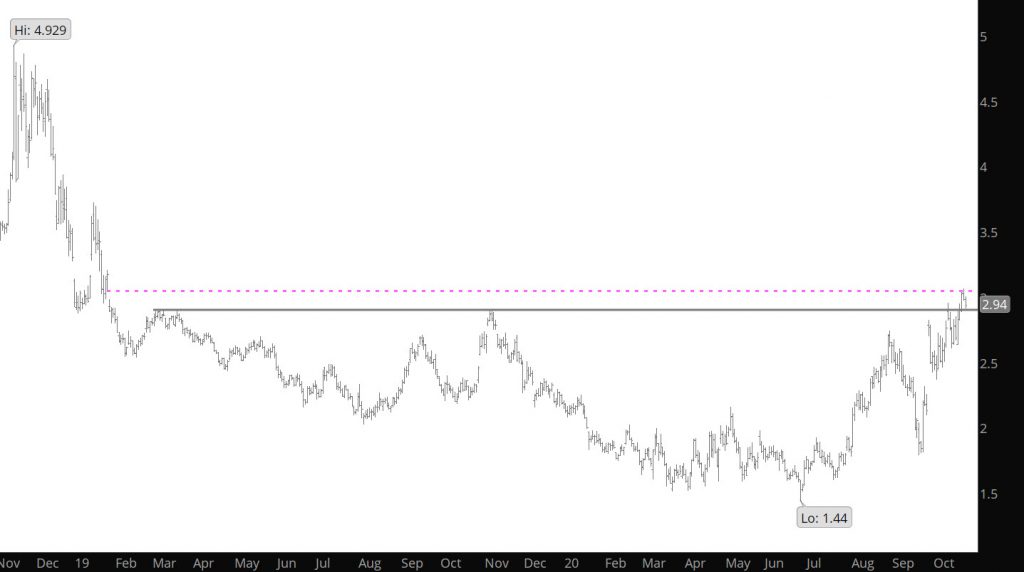
I did not think that the gap in the Daily Chart would be filled during November trade (pink line above), but like other events I am wrong. There was never a doubt that the gap would be filled (that’s because Dec was trading north of the gap at $3.34), but filling it with November has some implications. As mentioned in the Daily, the fact the gap was closed is important but prices did not close the day above that gap ($3.047), which leaves it unconfirmed. More importantly, when the market closes above (the Nov or Dec contract) the level around $3.00-$3.04 it will then become support (what was resistance becomes support) for a potential extended period of time. That said, should Nov remain above this area, expect Dec to at least test the zone during its tenure. The longer the zone remains support it may be the base for a period of weeks.

This rally has been based on some sort of fundamental driver and should that driver be mitigated then prices may trade around this area or below for a few sessions and possibly into and through expiration. If the driver remains and this area become support then its a new world for the near term and you have to look at higher prices for resistance because a floor has been established.

To read The Daily Call you must be a subscriber (Current members sign in here. )

September High for November Remains
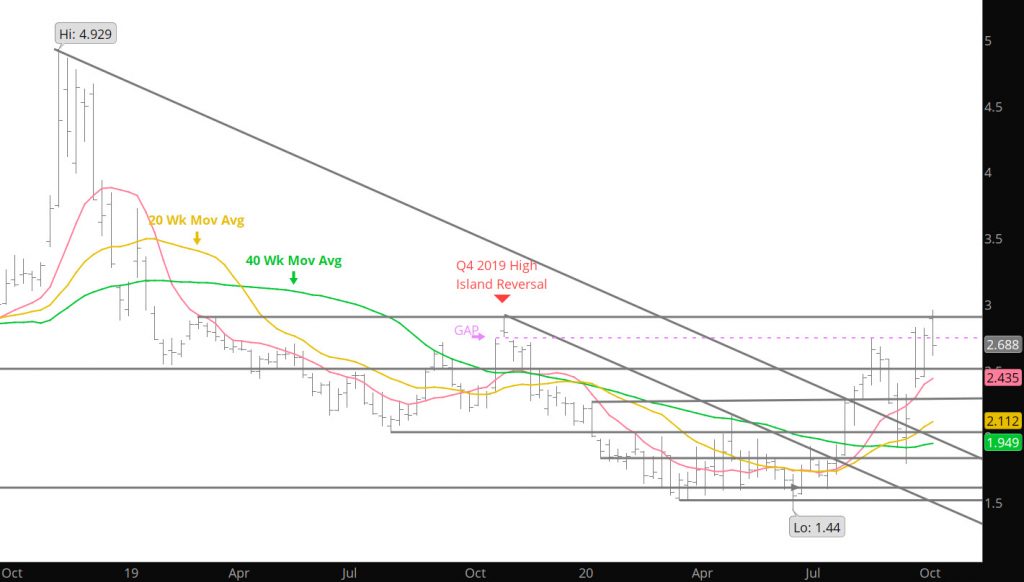
Weekly Continuous

The high for November gas printed just over $3.00 in early September and while last week provided a marginal attempt to get back to that level, the rally failed reversing and closing near the lows (in fact after the regular session was finished the late afternoon traded much lower). The late declines took prices to close just about on the 10 week SMA. The week’s action occurred on lighter volume and declining open interest (highest volume on the declines).

Since prior to the beginning of November’s tenure as prompt it has presented a volatile trading range (basically +/-$2.40 – $2.90). Trade gave up the a significant portion of the substantial premium awarded at October expiration. Action then had November trading through its September low (and its 200 – day SMA) before regaining that SMA, and significantly more, when it traded to a higher continuation high at $2.955. This failure at both of the extremes suggests that the volatile range will continue through the remainder of the November contract. This price behavior will mimic other years when there has been such a significant premium.
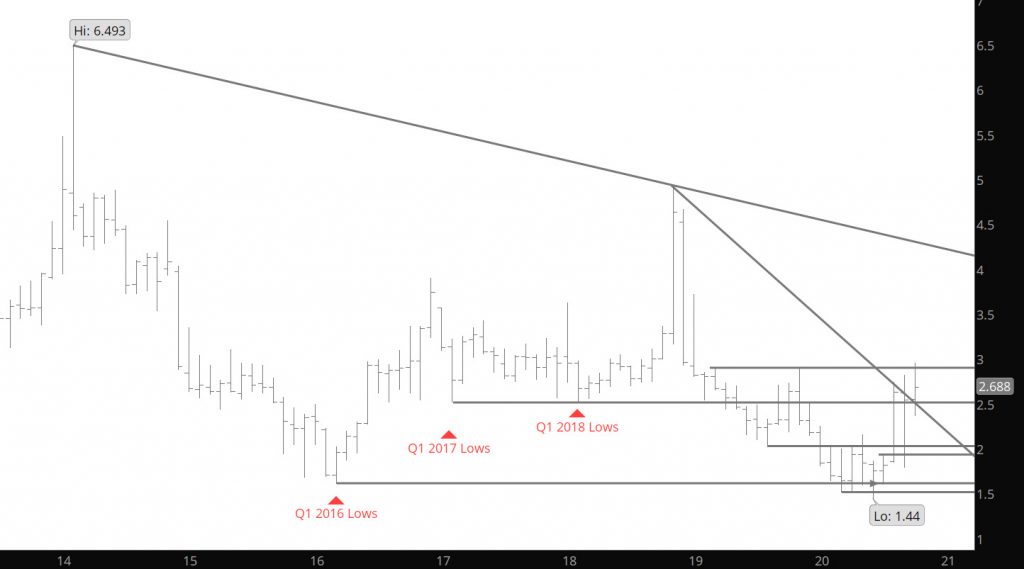
Monthly Continuation

While the Nov contract has traded in a volatile range ($+.55) this month the differed contracts have not provided the same level of volatility. December traded within a +$.35 range since the expiration of the Oct contract and similar narrower ranges occurred in the other winter differed contracts. I will be going into the open interest and volume of the differed contracts during the week so be sure to check.

Major Support: $2.476-$2.446, $2.392,$2.258-$2.253, $2.219
Minor Support: $2.618, $2.508, $2.339
Major Resistance: $2.789-$2.801,$2.908-$2.928,$2.973-$3.00

After Weak Start — Nov Firms
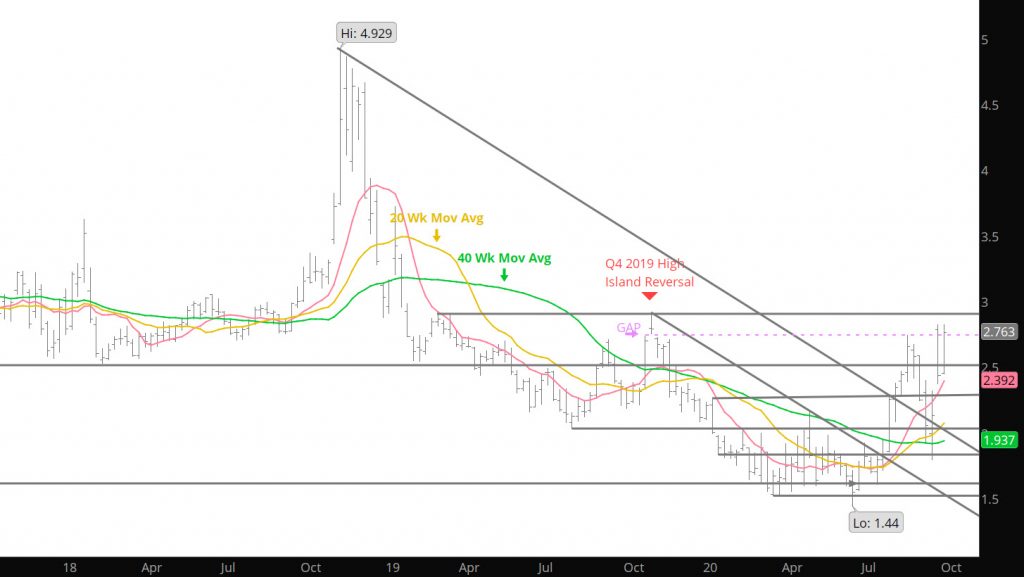
Weekly Continuous

When trading opened last week on a run and didn’t look back, rejecting the the $.369 decline of the week before and closing above the gap from last November. The market traded to the highest level since before the Nov ’19 highs but did not contain the technical indications supporting additional gains, instead they evidence shows that the rally was on short covering (more below) when prices eclipsed the 50 day SMA. Open interest in the prompt contract declined over 100,000 contracts (over 30% of total) which is significant this far before the expiration process and the fund rolling period.

Monthly Continuous

In previous discussions, there were four years when November commanded a large premium as October expired. Those four hears between ’04 and ’09 were afforded a premium between +/- $.62 and $1.47, this year’s was $.694. Each of these previous years there were some similarities to trade after the October expiration. 1) The expiration gap that resulted from the premium was reduced but the gap was not closed until the following year. The low, so far for Nov has not closed the gap from the Oct expiration; 2) the Q4/seasonal high had yet to be traded (the earliest was at the beginning of December’s tenure as prompt), this year’s has yet to be defined; and 3) November constructed a volatile trading range, The first two weeks have had above average true range.  Last week’s action left the Nov contract at a $.64 premium to October expiration where it started the month. The last week’s range continued the range expansion of the last four weeks ($.47+,$.525, $.769 and $.375) supporting the concept of entering a volatile trading range environment.

To read The Daily Call you must be a subscriber (Current members sign in here. )

Prices Converge on the Premium to Nov
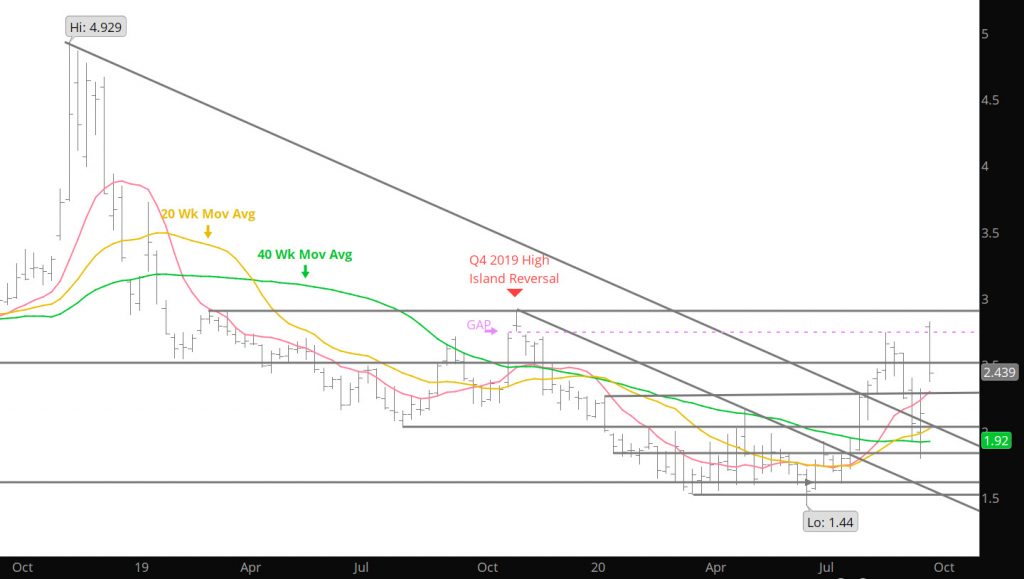
Weekly Continuation

Prices did not close the expiration gap but dove into a large chunk of the premium afforded the November contract. The declines fell short of the expiration high at $2.32 and nowhere near the October expiration at $2.101 nor the high of expiration day at $2.176

The November premium began to reduce as soon as October was off the board, even though prices closed the gap from November ’19 on the first day as prompt. From there November contract traded an “outside” month and closed below the November contract August low and its 20 – week and 200 – day SMAs.

To read The Daily Call you must be a subscriber (Current members sign in here. )

Start of the Winter Contracts
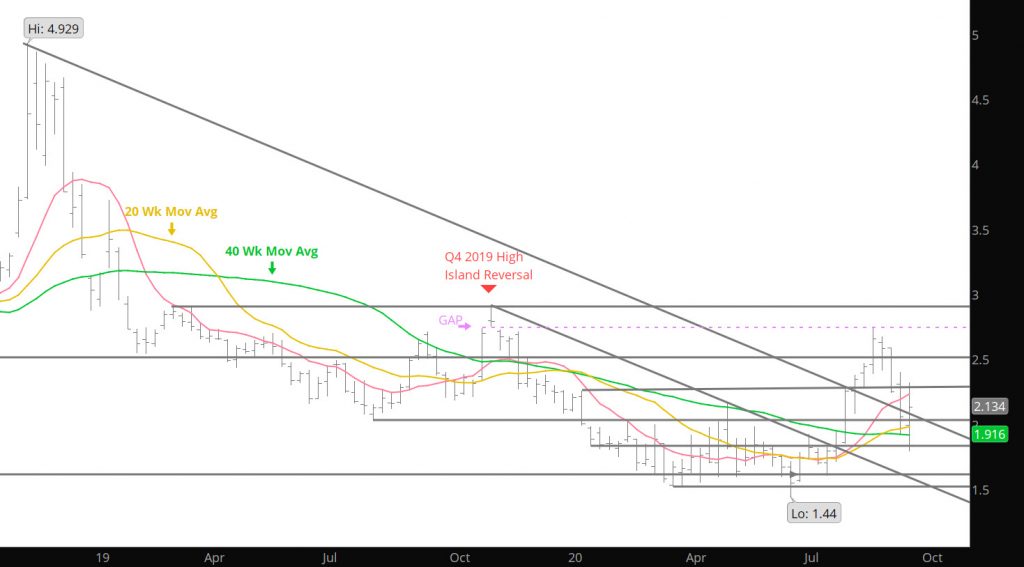
Weekly Continuation

A wild week for gas prices as prices started weak and tested the lows from late July, trading down to $1.795, then finding support and rallying prices back up to the initial support from the collapse the week before at $2.275. While prices pushed above that level briefly, they settled the week backing off.

While prices have had a wild ride with the October contract ($.53 range between high and low), the same cannot be said for the November contract ($.41 range). The premium afforded to November expanded and is approaching an extreme level.

To read The Daily Call you must be a subscriber (Current members sign in here. )

Prices Return to the Mean
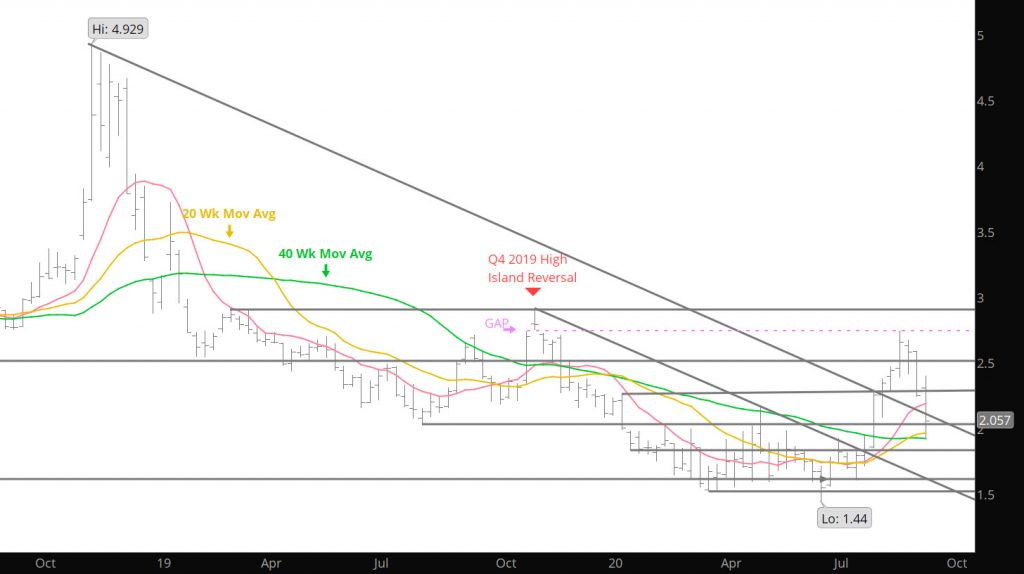
Weekly Continuation

Price action in commodities usually have a regression to the mean after spending an extended period of time at extremes. Trading greater than 2 standard deviations above the 20 week SMA for five consecutive weeks is trading at an extreme. While there was a relaxation of that extreme the week before last, the market was due for a regression at some juncture. Last week, the regression took prices back to the 200 day SMA, the 40 week and the 20 week SMA before finding support.

Monthly Continuation

Currently, the market remains within the extremes from the August price behavior. With all of the moving averages poised in a tight range (a nickel range) just below, an additional break down like last week seems unlikely.

To read The Daily Call you must be a subscriber (Current members sign in here. )