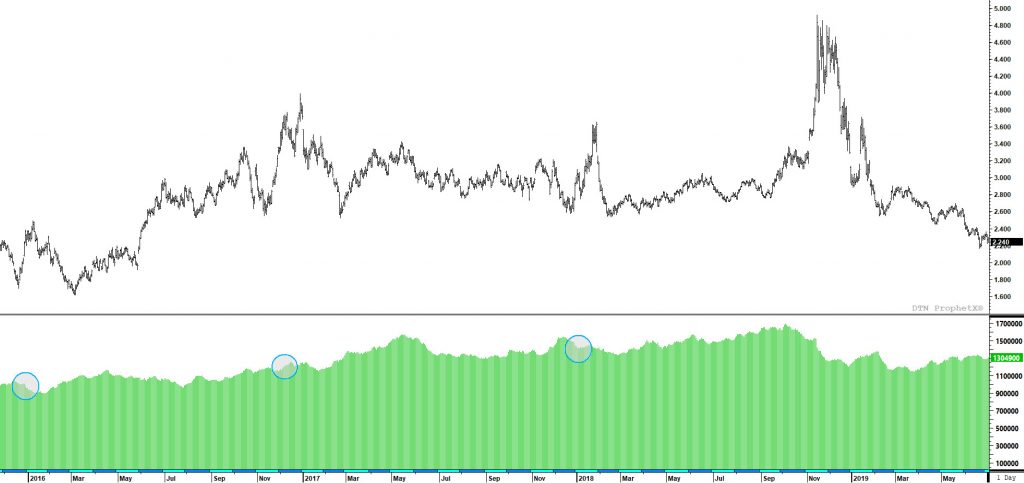
Weekly Continuous with Open InterestWeekly Continuous with Early Winter Lows
You will notice the chart directly above and remember it from two weeks ago. I wrote about it this way…”Take a look at the chart above– each of the blue highlighted circles represent an early winter low as the market was under the cacophony of bearish claims highlighting the status of winter. Notice the reversals off of the lows– each over 30%. In 2015, prices bottomed at $1.68 only to reverse and trade up to $2.49 (over 47% increase). In 2016, the price low was $2.546 and the reversal took prices up to $3.994 (57% increase). In 2017, declines stopped at $2.568 and reversed upward to $3.34 (30% increase).”
Now look at the chart above it — it represents the driving force behind the rallies with culminated between the end of December of those years through the end of January. Many of you know that the underlying premise of mine is the Q1- market trades to a low, Q2 – trades to a high, Q3- trades to a low and Q4 – trades to a high. At this point the market has conformed properly with this pattern with the highs last Oct and Nov, but I am not convinced that the Q4 high has been defined. I also have 2020 history showing me that the Q2 rally occurred over a historically short period of time (five weeks) and the Q3 low occurred at the end of June (technically Q2). This year has provided some odd behavior (variance from historical standards) for gas and adds fuel to my doubts about current actions. A primary reason for my doubt is the short interest in the contract. Looking at the top chart — notice what drove each of those rallies off of the lows was short covering at the start or during the rally and we currently have a large short interest (not excessive). Should the demand forecasts continue to support or drive the price action– we may see some speculative short interest covering.