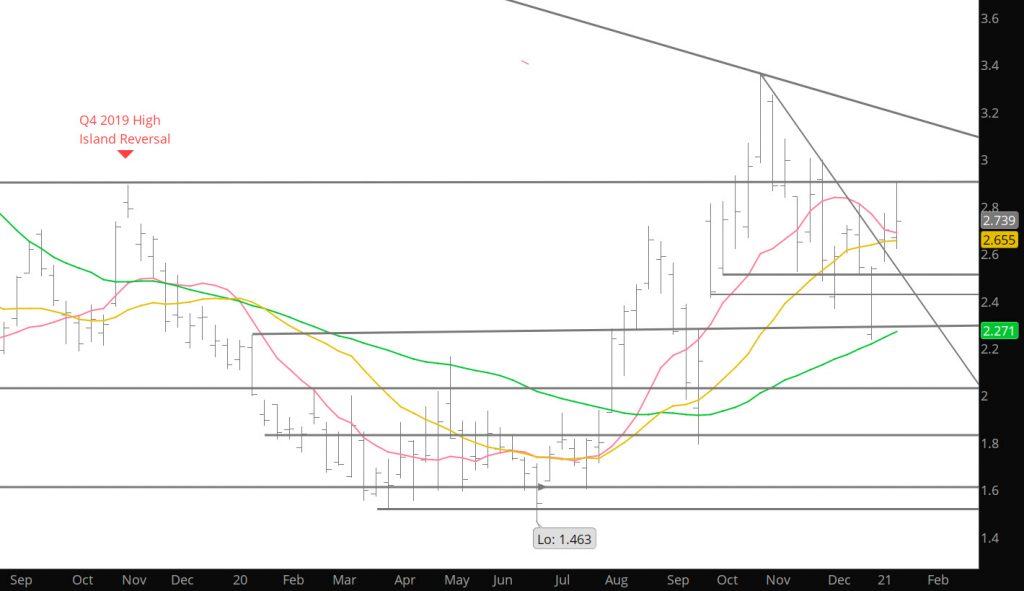
The weekly chart above shows the weekly reversal from the December low followed by a gap higher to begin ’21; the two weekly closes above the trend line declining from the October high and December high; and this week a close above the ten week SMA. While these actions could lead to a bullish bias to trade, still expect another test of support and the area around $2.60 has become a well defined area for initial support. From there the gap between $2.566 and $2.547 which still exists in the Daily and Weekly charts.
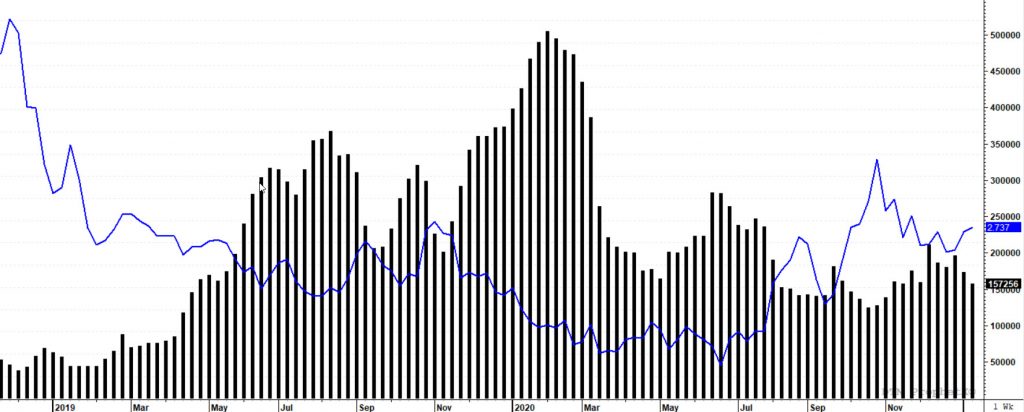
Managed Money Short Positions vs Price
Last week’s close occurred with an increase in weekly volume but additional declines in open interest. The chart above shows the open interest declines occurred partially from the speculative interests leaving the market. It is interesting that the speculative length entering the market offset the losses from the shorts leaving the market. For the market to achieve significant gains the open interest will have to start gaining as well as maintaining the gains in volume.