Started the research going back to 2010 but really figured that few of us remember trading the commodity that far back (unfortunately I do). So I limited the study to the recent history and found the necessary data to properly warn you. This is not to make a prognostication of future events but rather a response to a few of you who have contacted me that the “winter is over” and seasonal trends complete. I find your comments proof that none of us has a clue where prices are going for they haven’t proved accurate in the past.
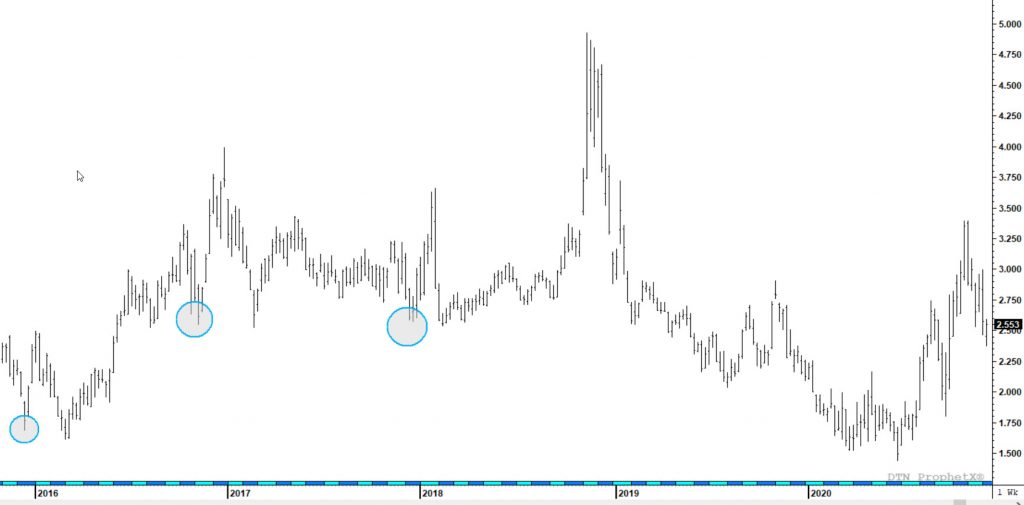
Take a look at the chart above– each of the blue highlighted circles represent an early winter low as the market was under the cacophony of bearish claims highlighting the status of winter. Notice the reversals off of the lows– each over 30%. In 2015, prices bottomed at $1.68 only to reverse and trade up to $2.49 (over 47% increase). In 2016, the price low was $2.546 and the reversal took prices up to $3.994 (57% increase). In 2017, declines stopped at $2.568 and reversed upward to $3.34 (30% increase). Not sure how much you folks want to risk but history has proven, it can be quite expensive for audacious calls based on “weather”. Should the lowest historical increase occur – prices would run up to over $3.00. Should the highest historical increase occur – prices would eclipse $3.70.