The Bull Run Continues

I need to clear up some house keeping issues– I am fishing for Walleyes this week at a lake in Montana. There is no cell service nor internet service at this area so there will be no Daily nor Weekly until my return on July 13th.

Weekly Continuous

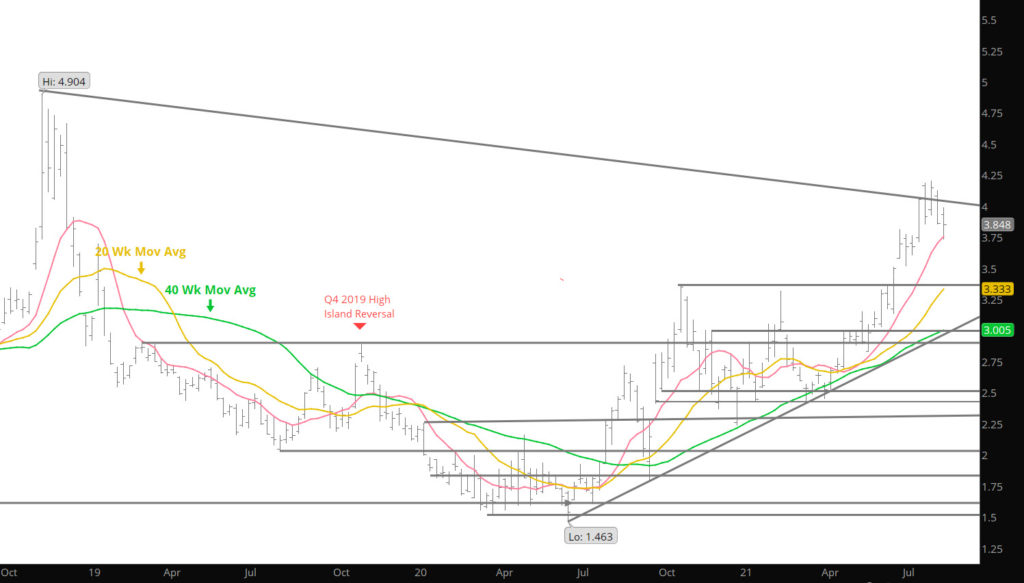
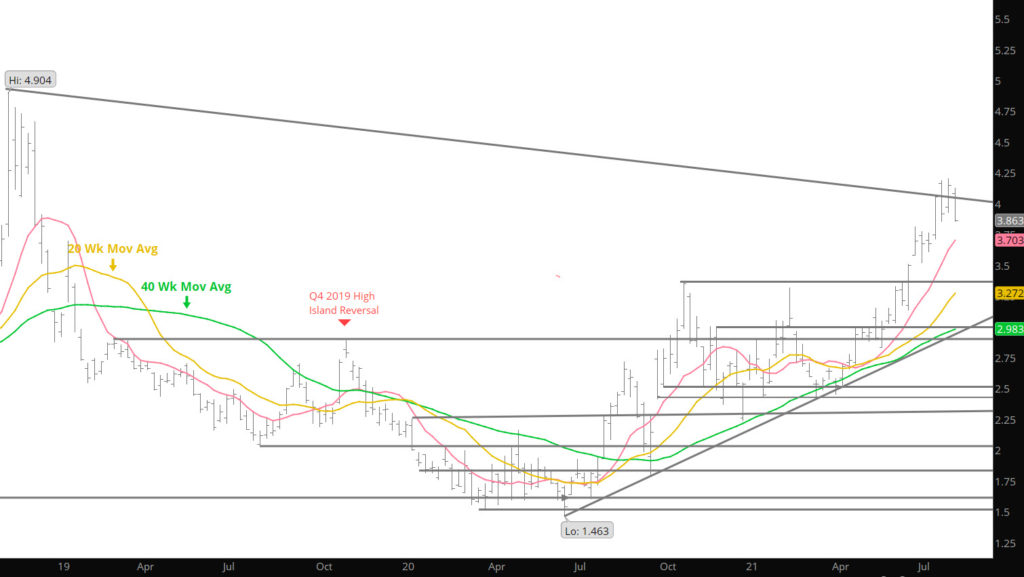
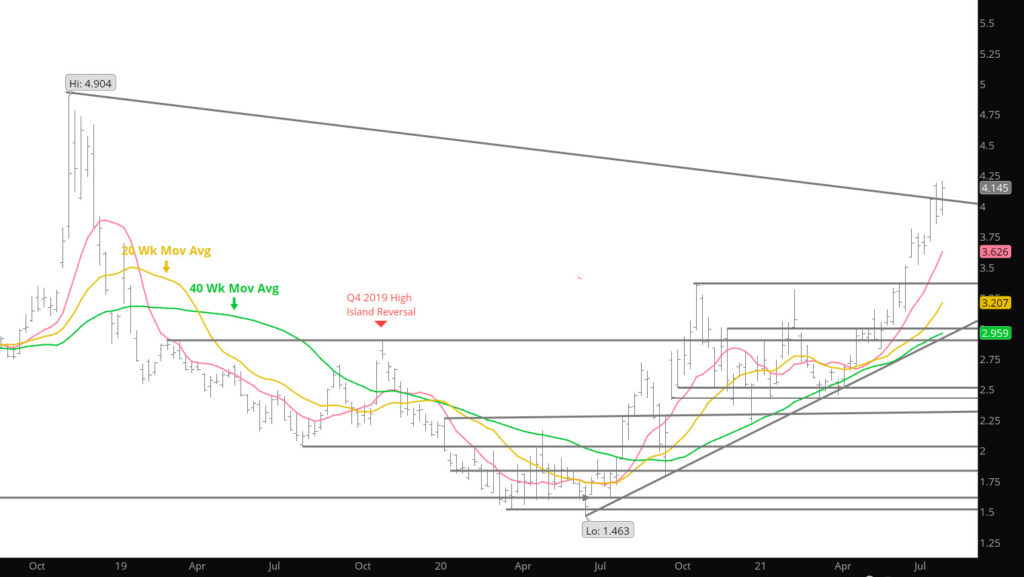
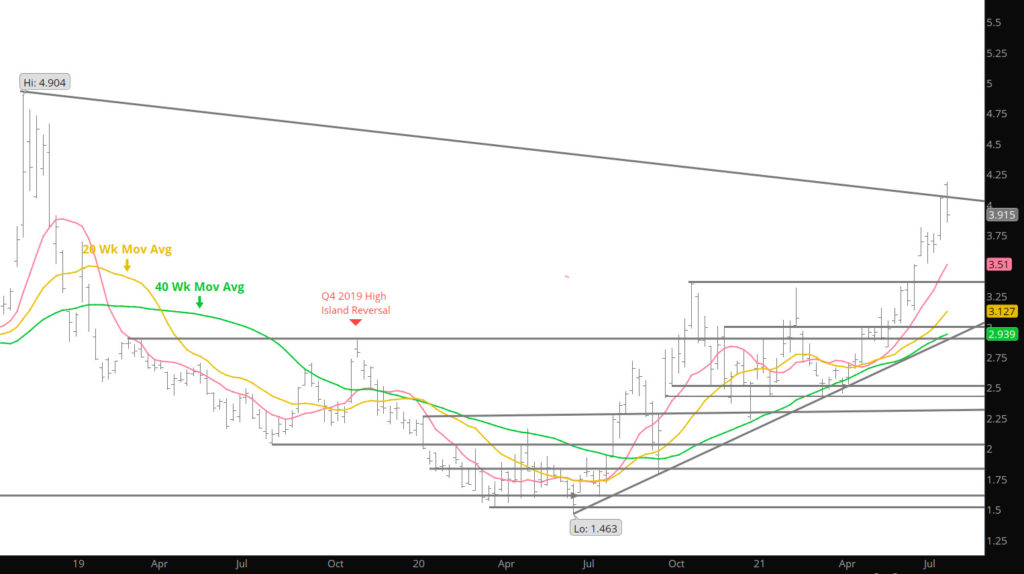
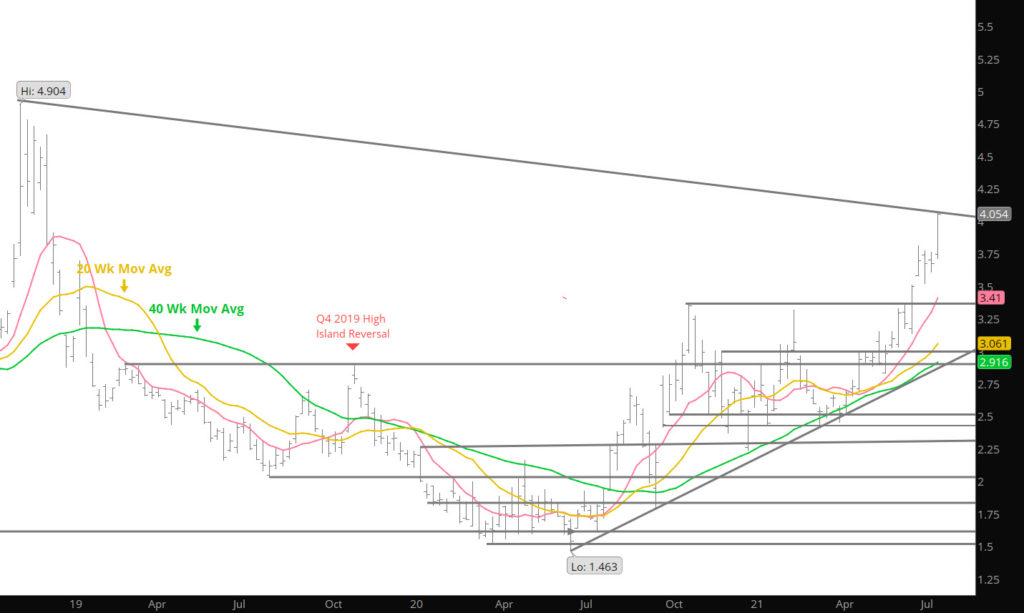
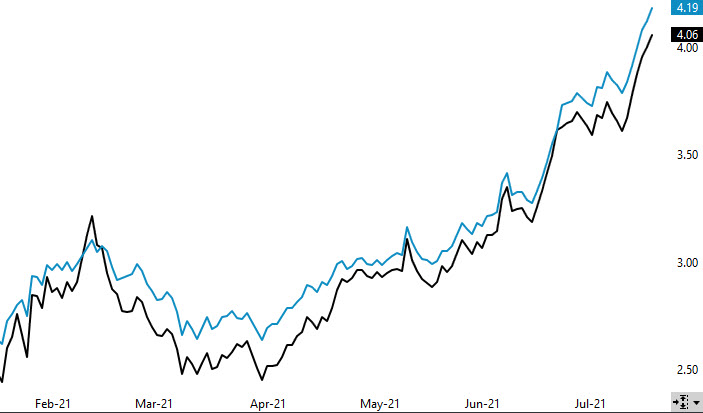
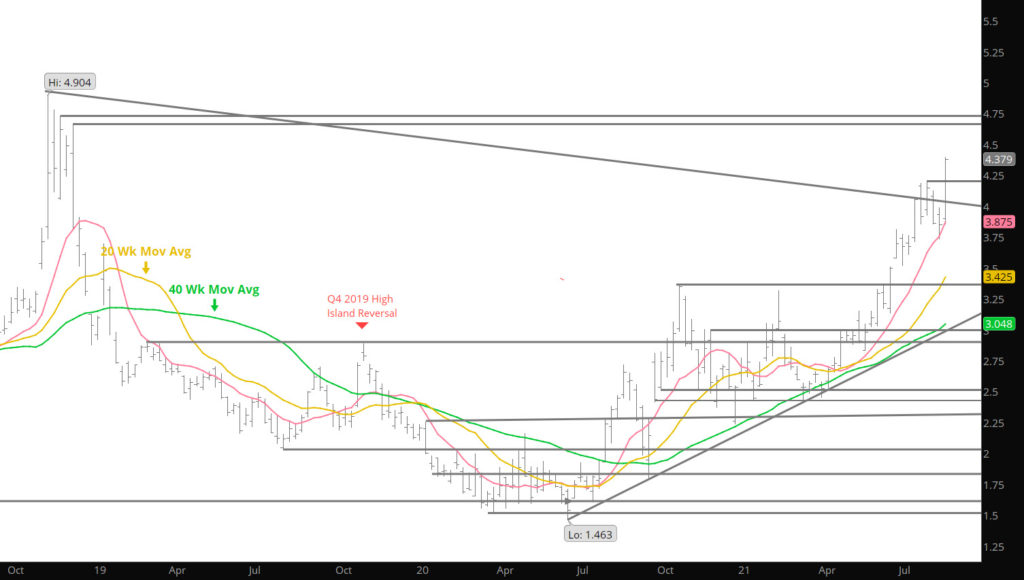
That said — this gas market is rocking as previous highs, that had kept a lid on prices rallies for two years, fell like lead weights on a lure. As noted here, I had been expecting some pull back and consolidation during this three week run, only to be shown the exit ramp. As mentioned several times this activity has brought the current overbought condition . Looking at two of my favorite condition studies; 1) standard deviation study (below) showing prompt gas closing between two and three standard deviations above the intermediate term 20 – week SMA for the third time in four weeks. This is a rate occurrence. There were two closes there in November of ’19 and there were four during the initial blast off from an extended trading range last summer. In both of those recent examples prompt gas traded back to and through the 20 – week less than a month later.

To read The Daily Call you must be a subscriber (Current members sign in here. ) Start your subscription today.

July Contract Rally Has Work to Do

Weekly Continuous

Last week, prompt July posted a new contract high and on Tuesday the prompt pushed a little further into the resistance zone between the February and October highs and appeared ready to test resistance presented by the October and November ’20 highs. July made it as far as 3.369 but with substantially reduced volume (333,249 contracts vs 633,921 on Monday) reversed lower and failed to find adequate support at/above Monday’s low. Trading a daily reversal with with increasing volume led to a lower weekly close after trading a rally high with weekly volume significantly less than the prior week. As discussed here numerous times that rallies need to be fed (volume), and that volume divergence (a higher high on lower volume) is a strong suggestion that July has traded the high of its tenure– whether it is the Q2 high remains to be seen.

Rallies from Q1 lows to Q2 highs have averaged 38.2% over the last ten years, 39.8% over the last five (43.4% over the last twenty). With last weeks rally from the March 18th low at 2.422 to this past week’s June high at 3.369 prompt gas has rallied .947, or 39.1%. That is fairly close to the five- and ten-year averages– but I am not convinced that the strength is finished (yes- I realize that a rally in July takes it out of the Q2 — but last June’s low at $1.42 was out of the Q3 but was the Q3 low).

To read The Daily Call you must be a subscriber (Current members sign in here. ) Start your subscription today.

Lots Happening

Weekly Continuous

Wow — that’s Natural Gas. The breakout last Friday brought back memories of when Natural was a brutally volatile commodity. Eliminating serious resistance zones ($3.198, $3.25,and $3.329) without blinking and testing the yearly highs with a range of $.181. However, perhaps the market got a little too exuberant when it tried to take out the Jan high of $3.329 (it traded just $.001 above) or the late Oct/Nov high of $3.396, before retracing the gains but still closing the week at the highest weekly close since that late Oct rally.

All of that action, left prices over the 2 standard deviation band above the 20 week moving average (chart below) and had prices hitting the extreme zone of the daily RSI chart and approaching the extreme zone in Weekly chart (see Daily further below).

To read The Daily Call you must be a subscriber (Current members sign in here. ) Start your subscription today.

Prices Firm Above $3.00

Weekly Continuous

Discussed my thoughts that the high for Q2 may not be in last week and I do not consider the retest of the earlier high of $3.15 last week to fulfill my expectations. That said, last week’s close was the highest weekly close in the July contract suggesting strength coming into this coming week. We have seen this type of activity several times this spring where the week ends well bid or well offered only to see a reversal when it opens the following week. I am not convinced the $3.15 is the Q2 high and would prefer a retest of support, followed by a rally that defines the Q2 high.

Prices did close right on the downward sloping trend line off of the Nov ’19 high that forms the resistance area for the “wedge” discussed previously. Last week’s action occurred with higher volume and gaining open interest which are both confirming market internals to higher highs yet to come.

To read The Daily Call you must be a subscriber (Current members sign in here. ) Start your subscription today.

July Takes Over

Weekly Continuous

June opened the week with a gap lower on Sunday night only to reverse and close the gap — settling at the higher end of the range it had traded most of the month. Once June was off the board, July, which had followed June’s directional movements, gave up the expiration related gain, retreating to retest its gap lower opening. July had begun trading at 2.920, traded to 2.903 and then rallied to 3.046. Thursday’s low at 2.914 along with June’s pre – expiration low daily close (2.886) likely redefines the key support zone. The new prompt recovered again from that support in typical low volume pre – holiday trade to end calendar May at 2.986 after ending April at 2.978 (developing a theme here). All of the Q2 months have traded down to lower levels, but all were also well – bid into expiration. You may recall that last year those Q2 months were far from well-bid after trading earlier lows.

Spot July Contract

The interesting chart is the Spot July contract which shows a higher low after each rally since the low of July last July. Different from the Continuous chart above, the highs in July have continued to be higher than the previous high which is variant to the Continuous price action. While the highs attained last month ($3.15) fulfill the rally of Q2 over Q1 lows (average rally) I am not convinced that that will turn out to be the final Q2 high. The prompt chart suggests that July has not finished its run.

To read The Daily Call you must be a subscriber (Current members sign in here. ) Start your subscription today.

Failure At Near Term Resistance

Weekly Continuation

Many of you commented last week that the price action reminded you of Feb ’21 when the market rallied (primarily on short covering) only to reverse by the end of the week forming a distinct bearish weekly reversal. Great observations– while the Feb rally to prices just short of the early Nov ’20 highs, last weeks rally stopped on the declining trend line of resistance (Nov ’19 highs and the Feb ’21 high). The reversal was quite sudden (similar to Feb) and left a bearish reversal.

Weekly Continuous with Bollinger Bands

The failure at the trend line was also confirmed by the failure at two standard deviations over the 20 Week SMA in both the Feb run and last weeks. All of this occurred on gaining volume and open interest- not supportive of large future gains in the immediate future.

To read The Daily Call you must be a subscriber (Current members sign in here. ) Start your subscription today.

Short Term Break Above

Weekly Continuous

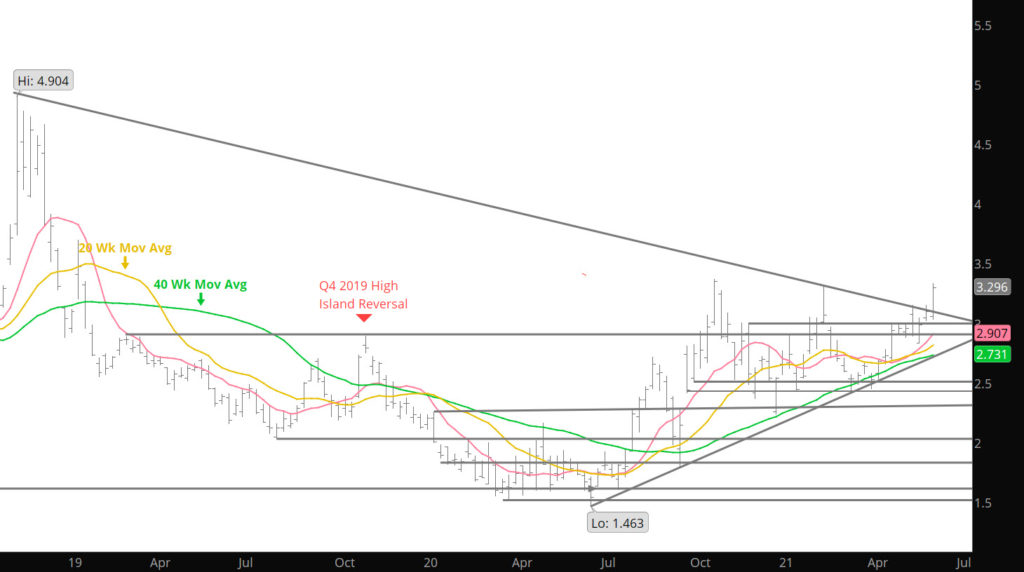
Last week provided a brief break above the key $3.00 resistance area, only to find the sellers that have appeared on previous tests, which sent prices back to the middle of the previous range the Jun contract has provided us. The run did send prices to the highest price for a prompt contract since February 22nd. The close last week did not provide a closing break above the declining trend line from the Feb highs, but early trade on Sunday night has broken the aforementioned trend line.

Spot June Contract

Last I mentioned the upside momentum that June built coming off the April low(gains of .149, .064 and .113 in three of the weeks).  Last week, momentum seemed to be exhausted with a fourth straight gain of only .027 and those gains were associated with slightly lower volume (week over week).  Consolidation (.$30 gain) may be occurring in the June contract but I would of expected significantly lower volumes under that scenario.

To read The Daily Call you must be a subscriber (Current members sign in here. ) Start your subscription today.

Rally Maintains Strength

Daily Continuous
Weekly Continuous

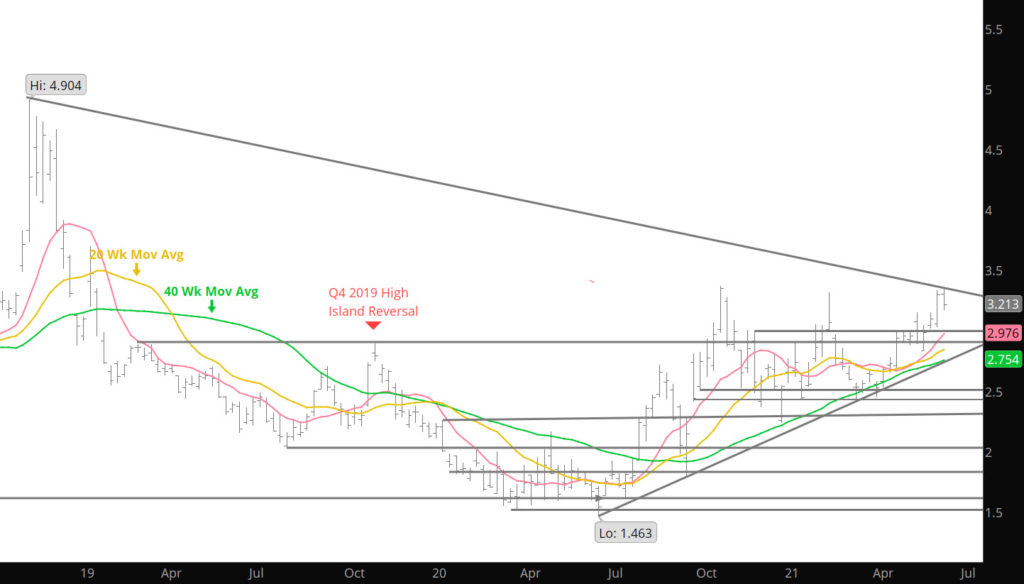
Last week continued the consolidation process in a fairly tight range. It may turn out that the prompt June extends the rally toward the upper boundary of the developing triangle ( trend line declining from the October – November and February highs, the current value of which is 3.256 in the Daily Chart above). There is historical precedent for June extending the rally later during its tenure as prompt. In ’19 the high of June’s tenure as prompt didn’t trade until 05/20, in ’18 June’s high traded coincident with expiration. From a historical stand point — since 2007 prompt June has traded through the calendar April high in 12 of 14 years (the only exceptions were ’14 and ’19) . The first trading day of May this year made it 13 of 15.

To read The Daily Call you must be a subscriber (Current members sign in here. ) Start your subscription today.

Higher Weekly Close

Weekly Continuous

Prices were well supported last week during the expiration process and with the first couple of days for the June contract as prompt. The action led to a higher weekly close for six of the last seven weeks. That just leads to confirmation of the recent bullish bias trend that has permeated the nat gas market of recent weeks with little or no fundamental reasons (at least the fundamental traders haven’t highlighted any to me recently).

Market internals show last week’s volume basically flat to the previous week and both of the last two week’s volume down from earlier in April. For an extension of the rally beyond $3.00, the bulls would like to have volume increasing as prices have gained in the last two weeks. Momentum indications (Daily and Weekly RSI being lagging indicators) are reaching the higher side of the range but are not over-bought. The weekly Bollinger band analysis also confirms that the trade is likely near the top end of the new range but prices could work another dime higher before signalling potential issues.

To read The Daily Call you must be a subscriber (Current members sign in here. ) Start your subscription today.

Expiration and Unknowns

Weekly Continuous

Last week prices trade through the resistance that limited the upper boundary of the recent short term trade and closed above it. While this type of event usually has supportive technical implications, the market internals (volume and open interest) did not, but it should be noted that the daily outside reversal on Thursday did occur on above average volume. This is all very short term interpretations and doe not alter the medium and longer term analysis that this web site has provided over the last few week. It is not uncommon for prompt gas to return to test the validity of “new” support (or resistance) once violated becomes support. Perhaps we will witness that type of action this week as the market heads into expiration.

Several positive technical aspects occurred in last week’s trade–prompt gas closed above the upper boundary of the recent range that has held action with the highest weekly continuation close since late Feb (2.854) and above the 10 Week SMA for the first time since that same week. Unfortunately, the second straight weekly gain came with decreased volume (this week average daily volume fell by an roughly 15,000 contracts while total open interest fell for the third straight week.  Look at the chart below:

To read The Daily Call you must be a subscriber (Current members sign in here. ) Start your subscription today.