Wow — that’s Natural Gas. The breakout last Friday brought back memories of when Natural was a brutally volatile commodity. Eliminating serious resistance zones ($3.198, $3.25,and $3.329) without blinking and testing the yearly highs with a range of $.181. However, perhaps the market got a little too exuberant when it tried to take out the Jan high of $3.329 (it traded just $.001 above) or the late Oct/Nov high of $3.396, before retracing the gains but still closing the week at the highest weekly close since that late Oct rally.
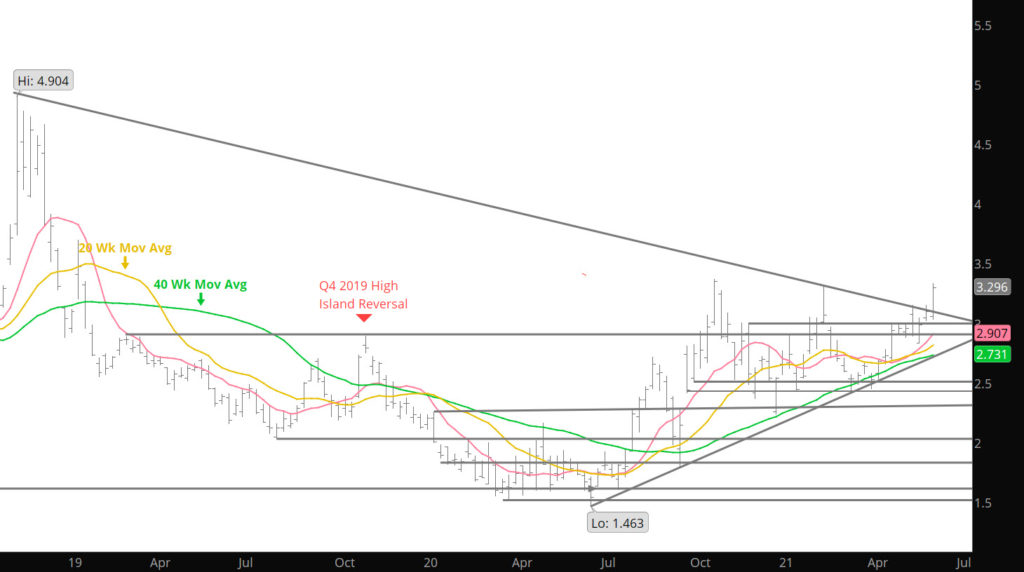
All of that action, left prices over the 2 standard deviation band above the 20 week moving average (chart below) and had prices hitting the extreme zone of the daily RSI chart and approaching the extreme zone in Weekly chart (see Daily further below).