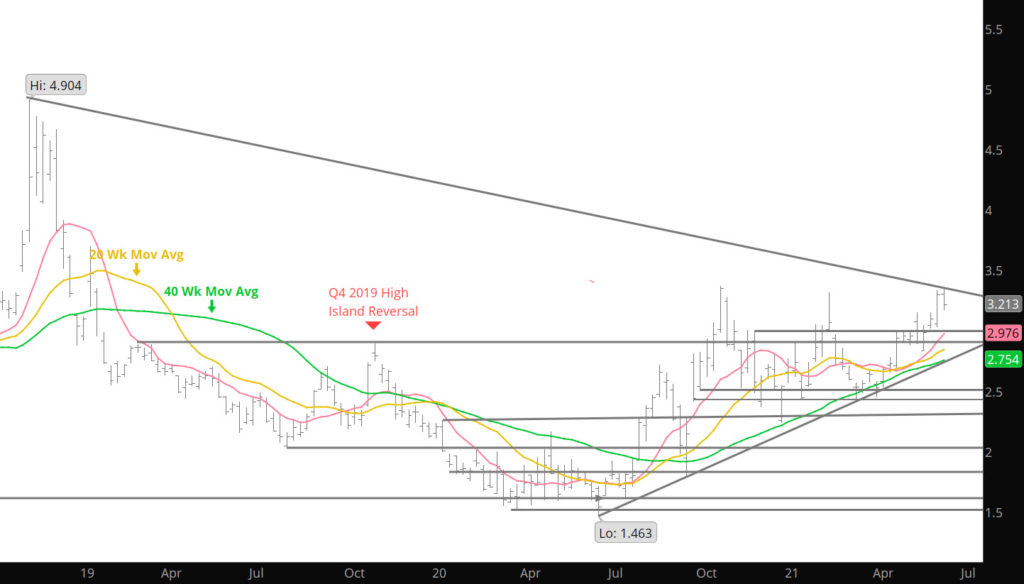
Last week, prompt July posted a new contract high and on Tuesday the prompt pushed a little further into the resistance zone between the February and October highs and appeared ready to test resistance presented by the October and November ’20 highs. July made it as far as 3.369 but with substantially reduced volume (333,249 contracts vs 633,921 on Monday) reversed lower and failed to find adequate support at/above Monday’s low. Trading a daily reversal with with increasing volume led to a lower weekly close after trading a rally high with weekly volume significantly less than the prior week. As discussed here numerous times that rallies need to be fed (volume), and that volume divergence (a higher high on lower volume) is a strong suggestion that July has traded the high of its tenure– whether it is the Q2 high remains to be seen.
Rallies from Q1 lows to Q2 highs have averaged 38.2% over the last ten years, 39.8% over the last five (43.4% over the last twenty). With last weeks rally from the March 18th low at 2.422 to this past week’s June high at 3.369 prompt gas has rallied .947, or 39.1%. That is fairly close to the five- and ten-year averages– but I am not convinced that the strength is finished (yes- I realize that a rally in July takes it out of the Q2 — but last June’s low at $1.42 was out of the Q3 but was the Q3 low).