A Reversal After A Reversal

Weekly Continuous

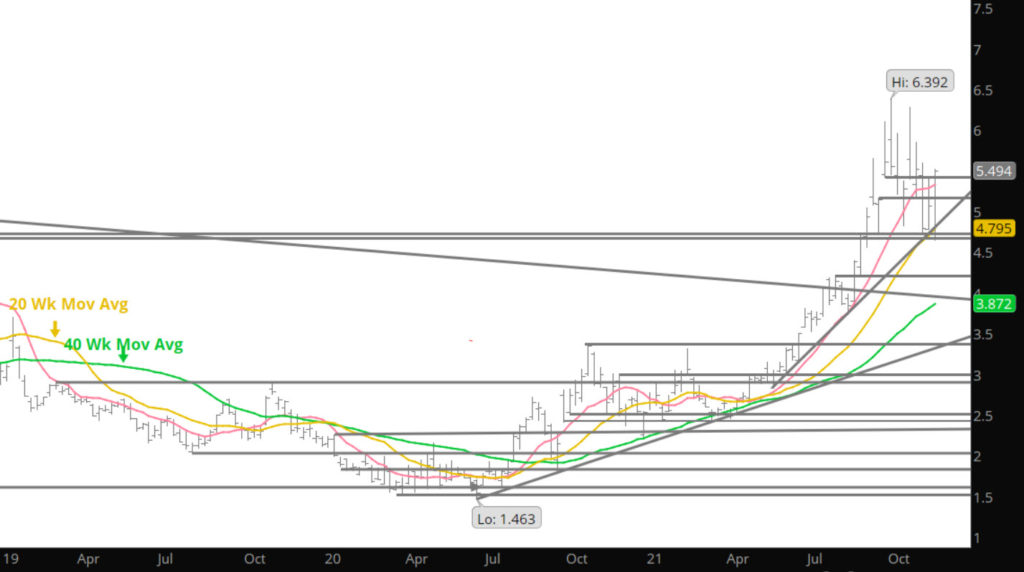
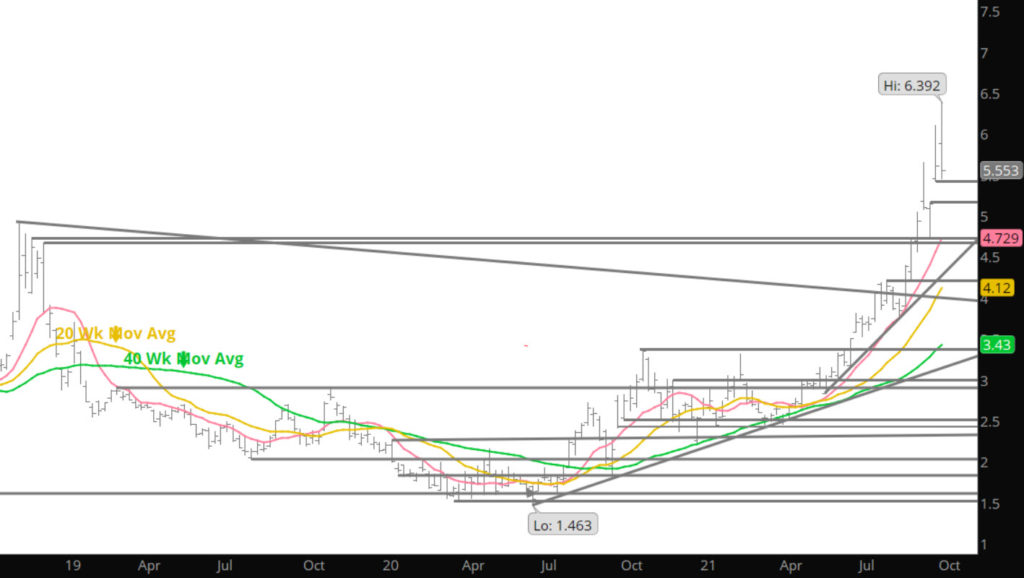
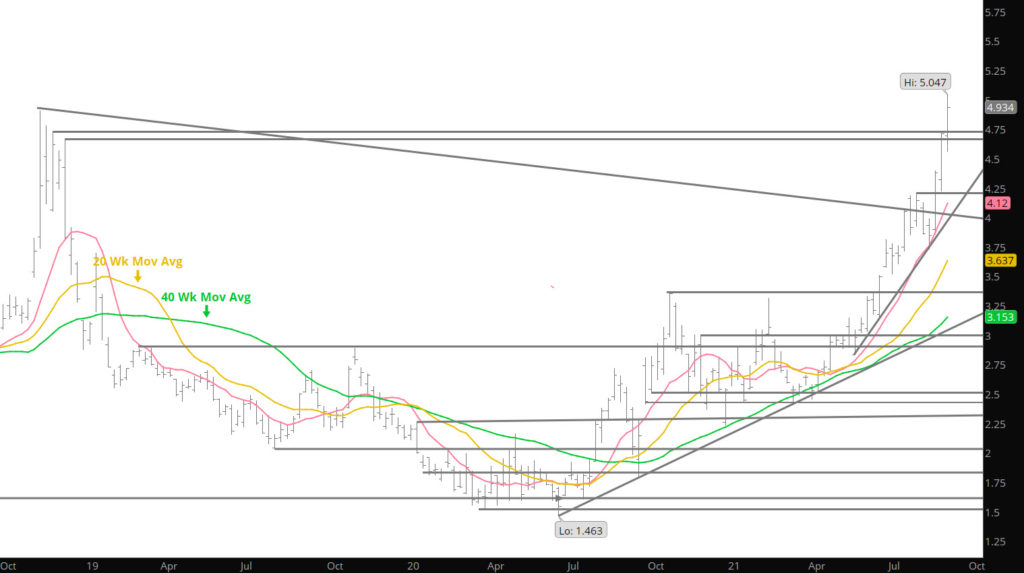
I am at lost to explain but the market seems to be telling us that it will be rallying into expiration for the seventh consecutive month. Last week we had a bullish reversal in the weekly close after the declines the previous week on a bearish weekly reversal after trading a higher high. There is a difference in the two reversals as the weekly declining reversal was on a higher volume and declining open interest, suggesting additional declines last week. Those declines were extended early last week, extending below the Q4 ’18 highs, then reversed after the storage report on Thursday. Last week’s reversal off of lows was on much lighter volume during the rally.

My comments last week alluded to what to expect later in the Q4 and continues to suggest that the rally has further to go, but not sure it will occur immediately.  If prompt gas intended to test the recent high in the near – term, there would have been more substantial volume during the recovery and rally last week.  It seems more likely that prompt gas constructs a continuation “coil” between those two extremes defined by the reversals ($5.65-$4.73) create short series of lower highs and higher lows, while the daily volatility (including the extremely overbought condition- weekly RSI), moderate.   

To read The Daily Call you must be a subscriber (Current members sign in here. ) Start your subscription today.

Dare We Mention Correction

Weekly Continuous

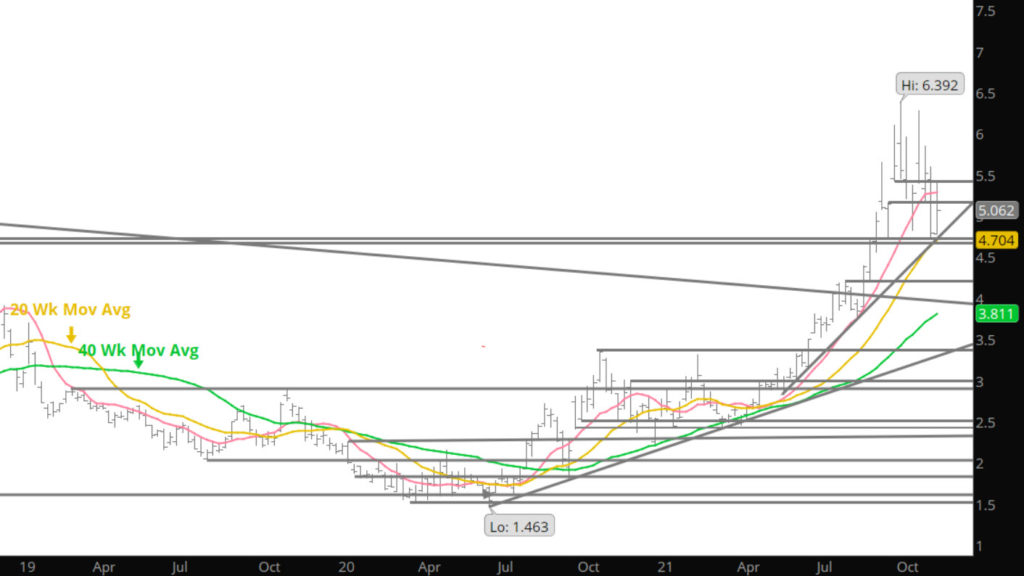
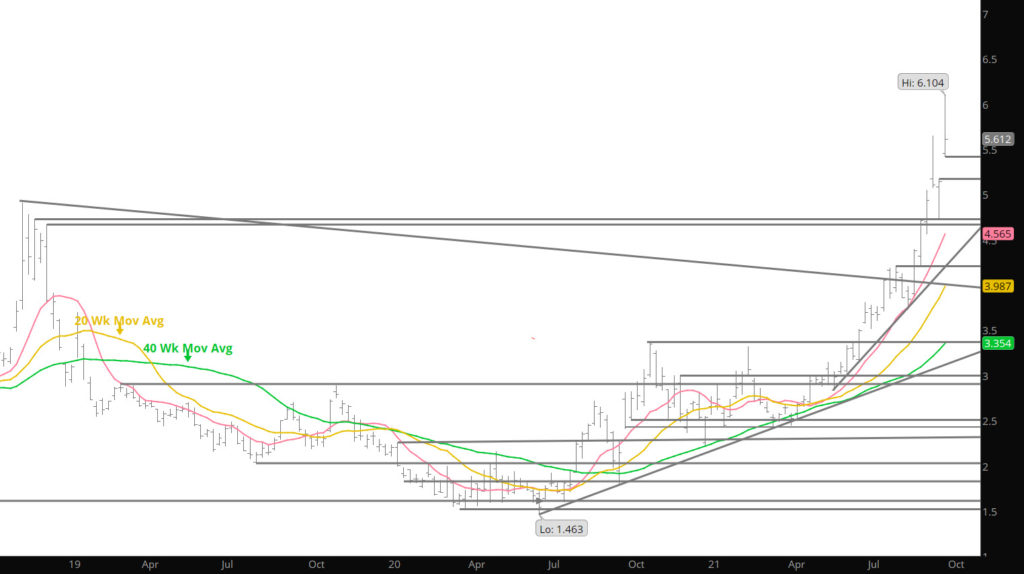
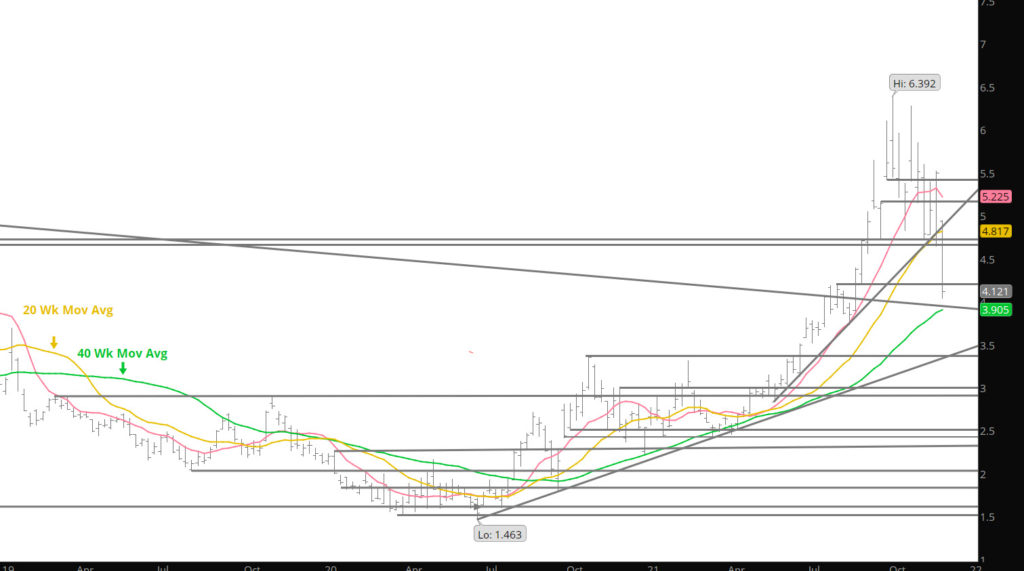
Prompt gas spiked to the highest price since February ’14 then fell 10.7% in less than three trading days. Some would consider that price action a reversal. For four straight weeks, prompt gas and the winter strip closed higher prompt gas and the coming winter strip closed higher even after the declines. For the first time since ’00 there was no definable price decline during the period bracketing Labor Day which, historically is one of the most consistent price negative periods all year.

Key elements of the declines / reversal was the declines in open interest (liquidation of over 30,000 contracts) with the highest weekly volume since last January. The highest volume day of the week was the reversal day (Wednesday) with over 778,000 contracts traded. That type of volume and reduction of open interest suggests that a correction was in process which was confirmed with trade later in the week.

To read The Daily Call you must be a subscriber (Current members sign in here. ) Start your subscription today.

Run Runs Onward and Upward

Weekly Continuous

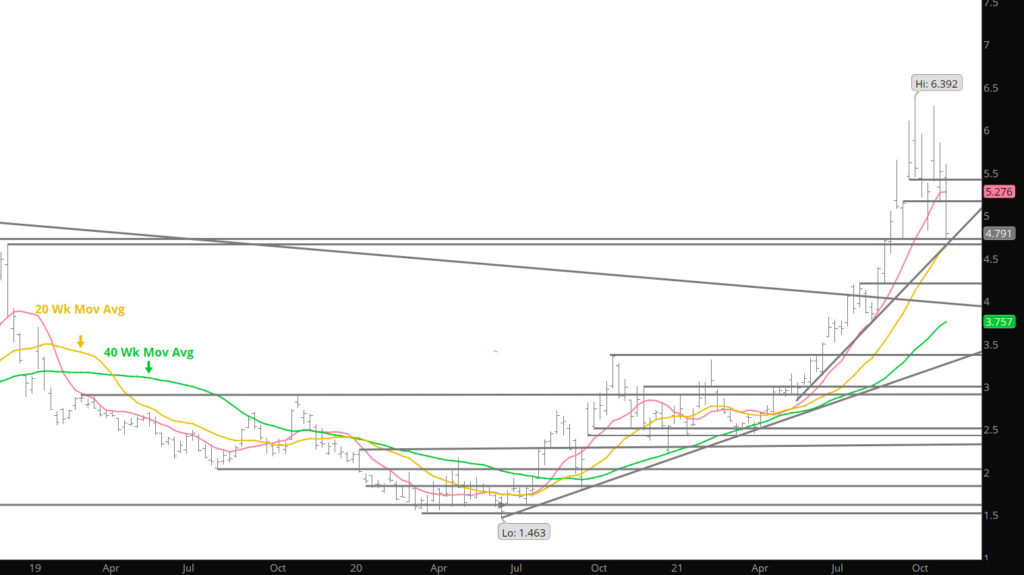
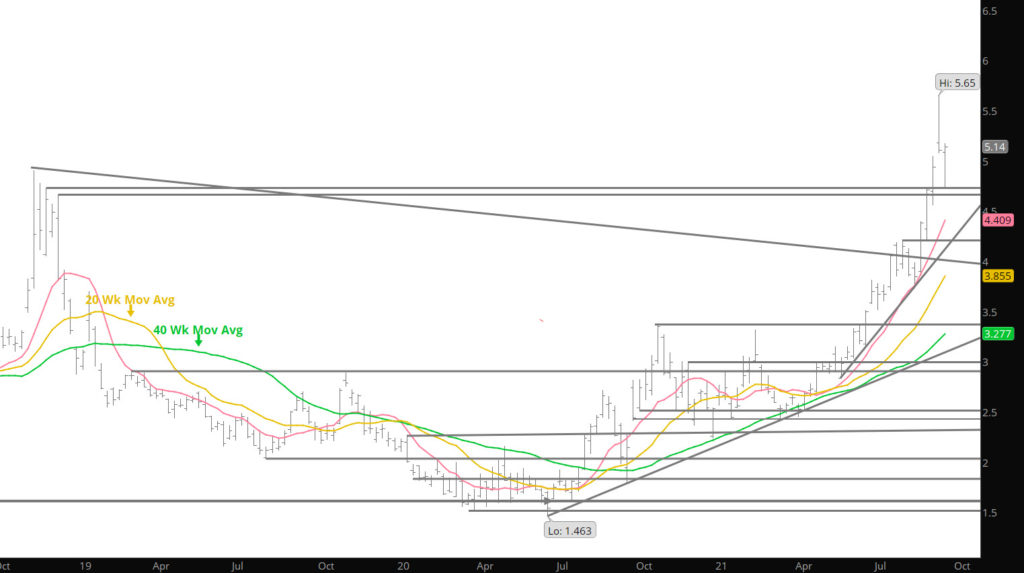
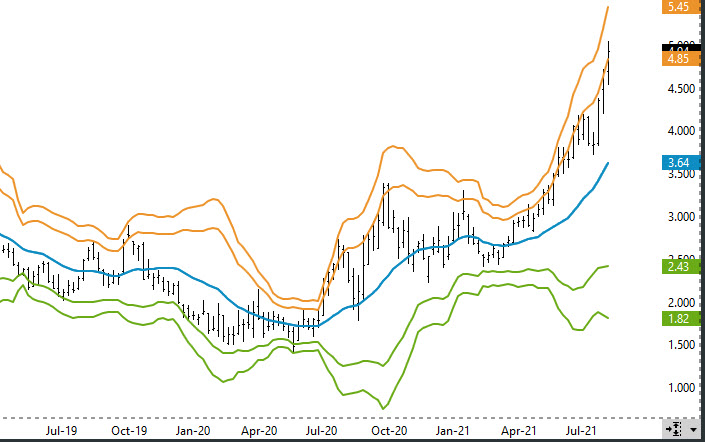
The last three weeks have provided over a $1.21 gain in natural gas prices and three consecutive weeks of prices rising over $.45. This has left the market over bought from several measures. One of the best measurements is how far prices have gained are over the 20 week SMA (simple moving average). The chart below exemplifies that the market closed last week over 2 standard deviations above the 20 Week SMA.

Weekly Chart with the 2 and 3 Standard Deviations Above the 20 Week SMA

The key to this chart is how the market remained at or slightly above the 2 deviation band early in this summer’s run. Then for a few weeks, price action went flat and retraced a little of the gains. This is normal for bull runs as the market needs to consolidate the gains before establishing the next leg up or a major correction. This will likely occur with the recent run but the timing is unknown. The amount of the declines associated with the decline is hard to measure and the timing is the wild card. Another measurement that analysts will use is the momentum indicator provided by the Relative Strength Index (RSI). In the chart below (it includes the total open interest analysis) note the gains of late and over time send the RSI over 80 (considered the extreme zone). Similar to the standard deviation study, they don’t remain at these level for long periods of time with out some consolidation. The RSI is a calculated momentum process looking at history, the deviation study gives you a target for the upcoming trade.

To read The Daily Call you must be a subscriber (Current members sign in here. ) Start your subscription today.

Risky Week With IDA

Weekly Continuation

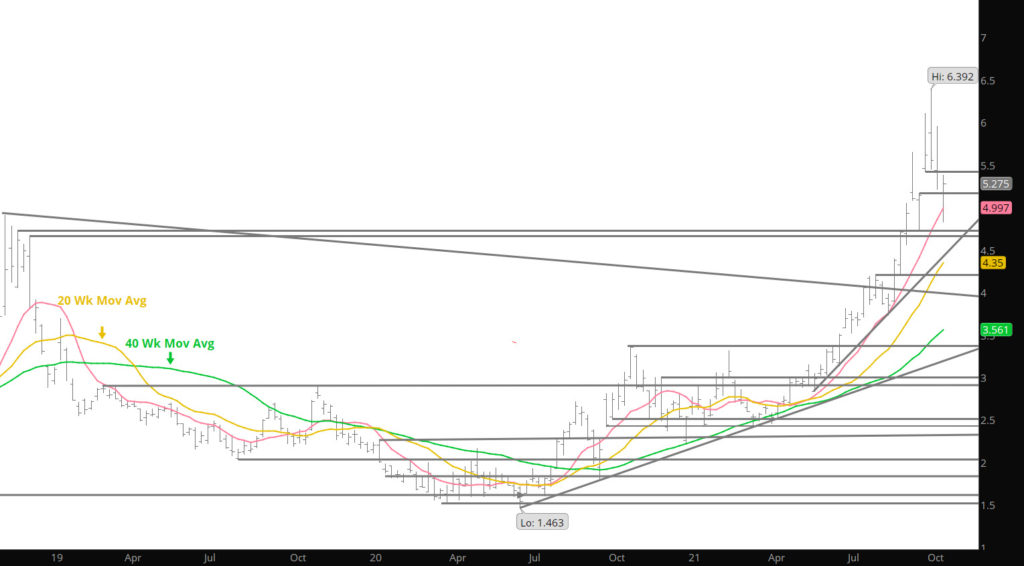
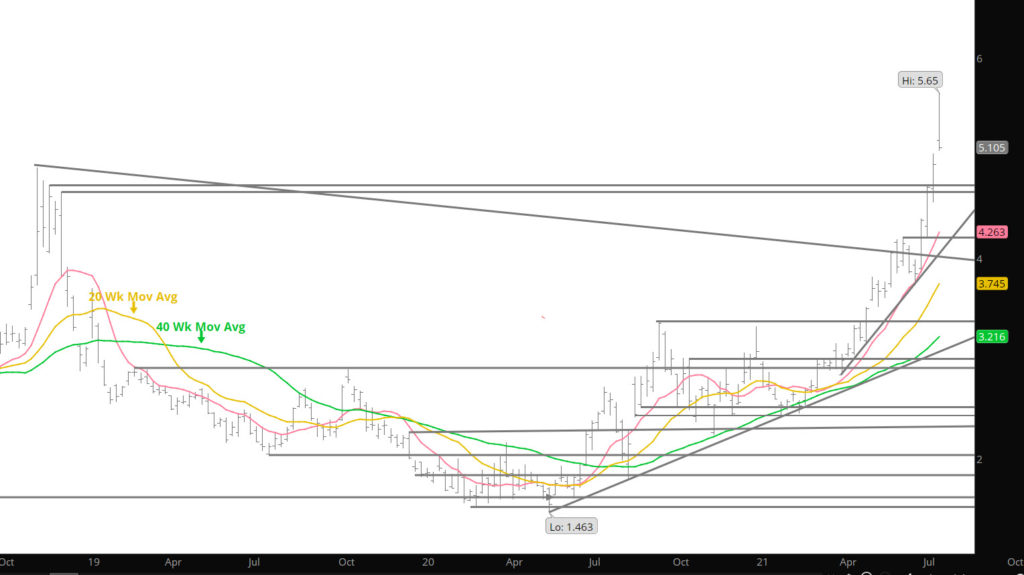
Last week brought the highest volume traded during its tenure as prompt as September became the sixth straight contract month to rally into expiration- the trend continues. Some fun facts — from low to high expiring September traded a range of $.559 which was the widest weekly range not including an expiration gap since the volatile decline following the Q4 ’18 high. With the expanded range (and volume) traded during the expiring prompts final two days September first extended the rally from the March ’21 low to a new high ($4.217 vs $4.205) and to a new high daily close ($4.184 vs $4.158 on 08/04) and then to the highest settlement since December ’18 that went off the board at 4.715.

Discussed during early August, when September contract first traded to $4.205, market internals did not support a higher high.  Volume and open interest were both lower than they had been five weeks before on a rally.  Those divergences strongly suggested that although the intermediate and long – term trends were higher the rally was on shaky ground and need a consolidation period (or a correction) was due.  September achieved that goal by dropping $.471 (+11%) over the next few trading days, closing higher only three times.  While expectations were for further declines were issued here as the reversal day low and weak close on Friday (week ago), are not the actions setting up the brutal blow out to the upside experienced last week.

To read The Daily Call you must be a subscriber (Current members sign in here. ) Start your subscription today.

Strong Lower Lows

Weekly Continuous

Prices traded down to interim support before garnering the strength to form a nice rally. Support from declines were found by the lower closing low suggested that significant support presented by the continuation 50 – day SMA and the trend line rising from lows traded in late May and late June. As noted last week this was the initial area for prices to be tested.

A mild warning here, in addition to that reasonably formidable technical support being tested and rallying –the last five expiring contract months have shown a consistent tendency of rallying during the final week of their tenure. Historical analysis continues to indicate that prompt gas…whether it is September or October, is vulnerable to more significant decline but given the tendency to rally into expiration…every month since and including February except March has (Feb closed higher each of its last three days, April three of the last four, May four of the last five, June two of the last three, July each of its last five and August eight of its last nine), it seemed prudent to alert traders of that trend that they have forgotten.

To read The Daily Call you must be a subscriber (Current members sign in here. ) Start your subscription today.

Historical Seasonal Weakness Begins

Weekly Continuation

After last week’s highest weekly close since December ’18, Sept made one more low volume push higher but failed well below the last two weekly highs at 2.187 & 2.205.  The reversal from a just slightly lower high (2.185) traded with the highest volume since the end of calendar June and continued to increase as the prompt fell.  Average daily volume for the week ending 08/13 increased an estimated 95,000 contracts and added up to the highest total in six weeks. This may have been the beginning of the seasonal correction talked about here for weeks.

Further evidence supporting the weakness theory lies with September declining for the second time in three weeks with a closing high sandwiched between.  The last time there were two declines in three weeks (continuation) was during the final stage of the weakness that ended with the March Q1 low. Since then price declines have been limited to a single week which were all followed by a higher closing high or one unchanged. (although there was that one unchanged close for week ending 07/16…the rarity of which was noted at the time). 

To read The Daily Call you must be a subscriber (Current members sign in here. ) Start your subscription today.

Yet Another New High

Weekly Continuation

What more can you say the uptrend that began more than a year ago (alerted at Ecom in the fall) tested support after expiring January collapsed to the December low, and again following the March test of the calendar January low continues. Nowhere is the rally more evident than in the further differed contracts. Since that last test of support –prompt gas has traded four higher monthly lows, and now five higher monthly highs while decisively trading through resistance clearly defined by the October, November and February highs regardless of the expectations of a significant correction.

The weekly RSI , which has reliably warned of significant highs during the entire history of natural gas trading, last week recorded the second highest reading since February ’03 (when it was higher for only one week). Other technical indicators are show some potential divergences to current trend. The failure of volume to confirm higher price highs last week and the previous week and that volume during July as prompt gas rallied to close at 3.914 was significantly lower than during calendar June, which closed at 3.650. This week’s higher high was not confirmed by a higher daily or weekly RSI reading.

To read The Daily Call you must be a subscriber (Current members sign in here. ) Start your subscription today.

Declines Expected With Seasonal Weakness

Weekly Continuation

If you are familiar with my diatribes over the years, you will recognize one of my strongest historical references is the consistent annual weakness that occurs in Q3on the corrections after the Q2 upward trend in prices. This year will not be different except that the Q2 rally did not end in June (Q2) but spilled over to July (Q3). While it would be more accurate if the market were to conform to the agenda , as traders we need to be flexible (for instance the Q3 low occurred at the end of June as the July contract expired) with our “rules”. History shows us that prices have a tendency to rally in late spring into early summer and then take a hiatus in late summer and early fall. Why this occurs is far beyond my pay grade and don’t really care– focusing on the trade rather than the “why”.

Last week brought a glimpse of the seasonal weakness that should occur in the coming weeks, trading a reversal week after setting a high early in the week before reversing lower during expiration and the end of the week. August gas traded as high as 4.187 before settling at 4.044. That was the highest monthly settlement since December ’18 settled at 4.715. On a weekly closing basis, prompt gas traded a technically price negative reversal lower but without the volume spike that customarily accompanies intermediate term highs. That should provide eager bears with some food for thought. The market has not confirmed the “all clear” against additional runs.

To read The Daily Call you must be a subscriber (Current members sign in here. ) Start your subscription today.

Something Is Amiss

Weekly Continuation

Lots of charts this week with just some brief commentary about the market that is not trading “properly”. There is a slight odor beginning to emanate from price action though not sure what it is. Looking at the weekly chart above– it looks like a solid bull run with little or no correction for the last 8 weeks– that is not normal behavior (especially for natural gas). Some fundamental based traders tell me it is concerns about supplies going into the upcoming winter — at face value the market is not confirms such concerns. Look at the chart below:

Jan 22 Daily Continuous vs Aug 21 Daily Continuous

The blue line reflects the upcoming Jan ’22 contract and has narrowed on the recent run to only $.13 over August. That does not reflect substantial concerns about the upcoming winter supplies. Much less– it takes the value of storage off the table as it doesn’t cover the carry costs much less the direct cost of storage. Winter should be rising at the pace of cash (or Aug) if winter was an issue. Perhaps it too will run later in the fall. When Aug corrected (very briefly) early in July the spread was out to $.20 which does reflect some concerns (prompt declines – winter declines less).

To read The Daily Call you must be a subscriber (Current members sign in here. ) Start your subscription today.

A Good Week to Go Fishing

Weekly Continuous

Gas traded an “inside” week — staying with in the previous week’s range and ended unchanged from last week’s close. I have tracked weekly ranges, opens and closes since the late ’90’s and I can’t think of the last time that the market closed almost exactly where it began (3.674 v 3.673). Friday’s close gave us three “tight” weekly closes (within $.026) which is also a pretty rare occurrence. This type of activity can clearly meets the standards of consolidation of the recent gains. Historically a market that is consolidating and struggling to establish momentum are usually resolved in the direction of the underlying trend with the release of technical “energy” that builds up during them triggers a significant range expansion.

That said, this market may be ready to attack higher levels but is missing some key indicators. Average daily volume has, on balance, declined since early June, while total open interest has increased significantly. Discussed here many times, bull markets have to keep feeding the beast. While it is good to see the gains in open interest, the change in “open interest” over time is a “lagging” indicator but historically substantial increases are inevitably followed by price declines while exceptionally low levels of open interest are characteristic of the construction of a low. Since the April low, the total number of contracts open in the market has increased from 1,164,269 to 1,466,459 (about 26% after already having increased from 1,117,622 with the January low). The last 155,057 of that increase has occurred since last month’s breakout through the October – November – February highs. That is a lot of new buying (which increases upside pressure on the bid) for a market that has gone absolutely nowhere for most of the last three weeks.

To read The Daily Call you must be a subscriber (Current members sign in here. ) Start your subscription today.