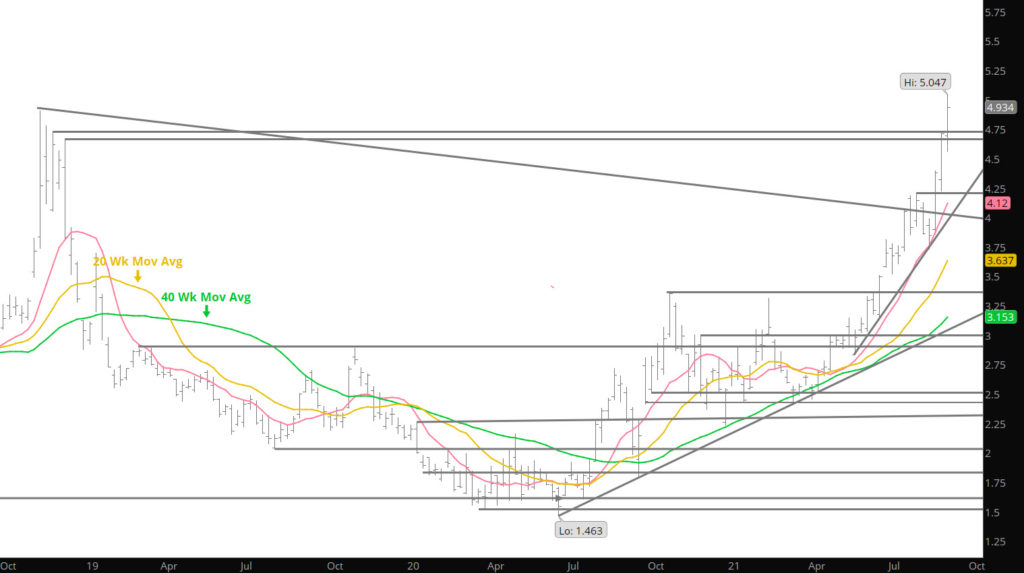
The last three weeks have provided over a $1.21 gain in natural gas prices and three consecutive weeks of prices rising over $.45. This has left the market over bought from several measures. One of the best measurements is how far prices have gained are over the 20 week SMA (simple moving average). The chart below exemplifies that the market closed last week over 2 standard deviations above the 20 Week SMA.
Weekly Chart with the 2 and 3 Standard Deviations Above the 20 Week SMA
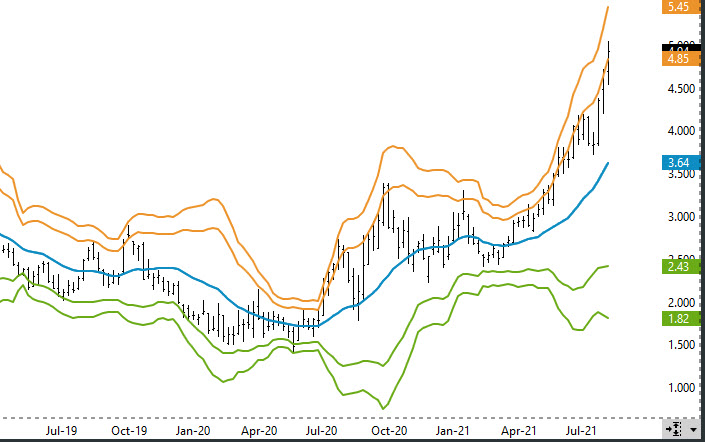
The key to this chart is how the market remained at or slightly above the 2 deviation band early in this summer’s run. Then for a few weeks, price action went flat and retraced a little of the gains. This is normal for bull runs as the market needs to consolidate the gains before establishing the next leg up or a major correction. This will likely occur with the recent run but the timing is unknown. The amount of the declines associated with the decline is hard to measure and the timing is the wild card. Another measurement that analysts will use is the momentum indicator provided by the Relative Strength Index (RSI). In the chart below (it includes the total open interest analysis) note the gains of late and over time send the RSI over 80 (considered the extreme zone). Similar to the standard deviation study, they don’t remain at these level for long periods of time with out some consolidation. The RSI is a calculated momentum process looking at history, the deviation study gives you a target for the upcoming trade.