Good Friday Observations

Daily Continuous with Volume

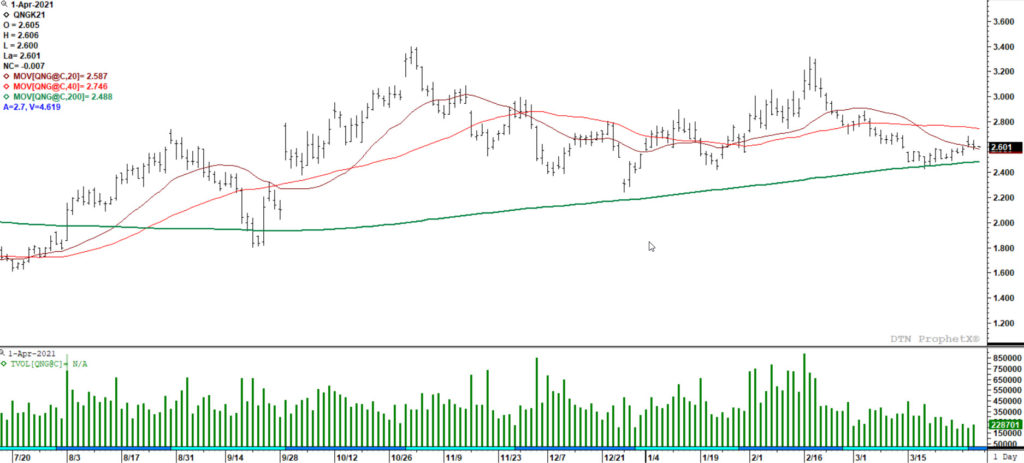
History shows that more often than not seasonal lows trade with declining volume. Volume on Sept 22nd was substantially less than the volume of the day before or day after. The retest of the late Dec low (also a relatively lower volume day) on January 22nd when the January low was traded at 2.414. The technical indication is that whatever downside momentum that was carrying prompt gas to that low, was or was about to be exhausted. Another way of analyzing this the sellers were running out of participation to drive the bid lower. Perhaps, a variation of that pattern is going on right now. A week ago, April gaped lower on Monday, traded quietly in a range for a couple of days then spiked down toward a test of the January low. Interestingly, the volume on 03/18 exceeded that of 01/22 by more than 100,000 contracts, suggesting that there may be enough additional selling (discussed here) to challenge the conventional and moving average support (the 200 day SMA was 2.447) and leave prompt gas below the trend defining 40 week SMA. Since that spike lower with 415,730 contracts traded the market has preformed an “outside” day reversal to the upside (March 24th). Average daily volume for week ending Mar 26th declined an estimated 80,000 contracts from a week earlier and was the lowest since the holiday shortened Christmas week. Perhaps there is additional selling waiting, but last week’s expiration suggests that volume has sufficiently dried up to indicate that there has been a successful test of the January low during March, looking like an intermediate term low with of the construction of the lower boundary of a trading range.

Some additional support for that view can be found in the change in open interest. The last three meaningful increases in the total number of contracts outstanding were on 03/12 (when selling continued into the weekly close, suggesting lower prices were in store when trading resumed discussed here), 03/15-when prices began the next week with a gap lower, and on 03/18-when April tested the 200 day SMA and January low. Those increases indicated that short sellers were throwing increasing positions significantly, attempting to drive it lower. These actions proved successful the first two times. April fell from a high of 2.714 on 03/11 to that 2.422 on 03/18. Since the 03/18 low open interest has declined each day indicating that gains have been significantly attributable to profit taking (the rally around expiration can also support this view) and does suggest that weakness should be bought near term.

To read The Daily Call you must be a subscriber (Current members sign in here. ) Start your subscription today.

Expiration April – What Bias for May

Weekly Continuation

April started its prompt role with a slight rally only to succumb 10 days into trade, left a gap on the declines, that remained as resistance until last week. The brief run closed the gap but there was unable to additional progress. Soon to expire prompt traded through a previous week’s high and recorded a gain for the first time in five weeks. This all occurred on declining volume which leads this writer to conclude that the chances of April expiration above that of March’s ($2.854) at slim to none.

May Contract

Now May comes into the spotlight as prompt on Tues. In the chart above the May contract also had a gap that finally closed last week. It also traded we with in the range between $2.49 and $2.64 similar to the range in the April contract. Some interesting developments in the open interest and volume that I want to dive into and explain later in the week. Not sure where the April is going to end, but regardless, May is likely to come back to the April close if it is weak and/or if April closes strong, May will likely try to extend those gains.

To read The Daily Call you must be a subscriber (Current members sign in here. ) Start your subscription today.
Seasonal Trends End Oddly in 2020

Monthly Continuous

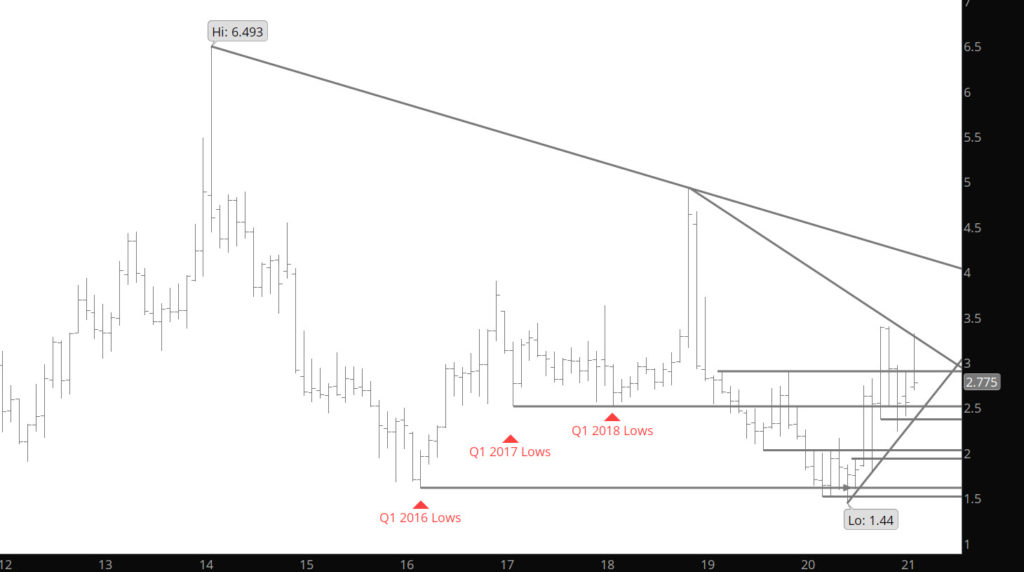
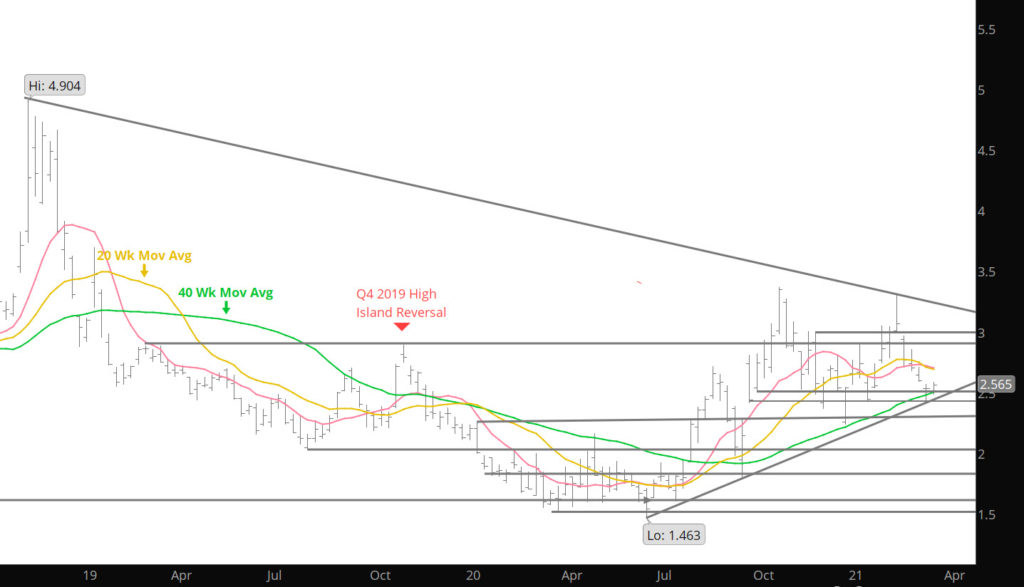
As most of you know, I have discussed over the years, the seasonal tendencies in natural gas, with the Q1 of the fiscal year showing weakness; Q2 bringing strength in prices; Q3 typically weak for prices; and the Q4 is met with support and stronger prices. Last year had some abnormal aspects to this historical pattern. The Q1 low came on time at the end of March; the Q2 high came in May after only a 13 day run; the q3 lows came at the end of June trade on the July expiration; and the Q4 high came in early November, a common theme. The Q1 low for 2021 seems to be December 28th low at $2.23 unless the coming six days bring a test. After last week’s failure to expand the lows significantly– not sure there is enough action to test and break the Dec low.

That being said, there seems to be great interest in moving prices lower as the Chart below shows. It seems that the Managed Money Shorts have recently blown out their position in the last couple of weeks. Since the middle of February the short position has nearly doubled and now stand at nearly 200,000 contracts. Looking at the price movement– it seems the sector sells the contract at the beginning of the week (the CFTC data is dated on the Tuesday of each week) as that is when the significant declines have occurred in the last couple of weeks.

To read The Daily Call you must be a subscriber (Current members sign in here. ) Start your subscription today.
Looks Like Lower We Go

Weekly Continuous

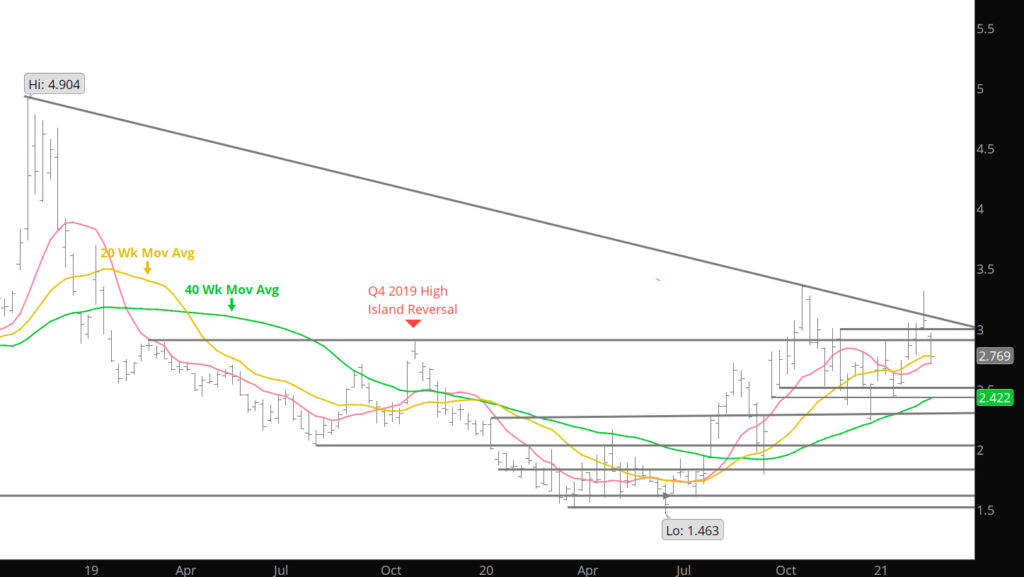
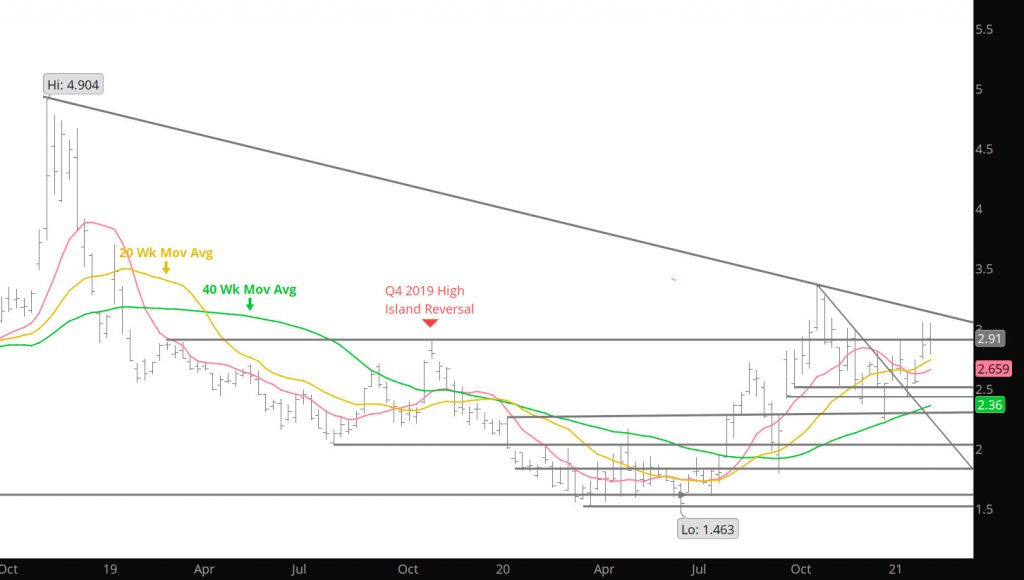
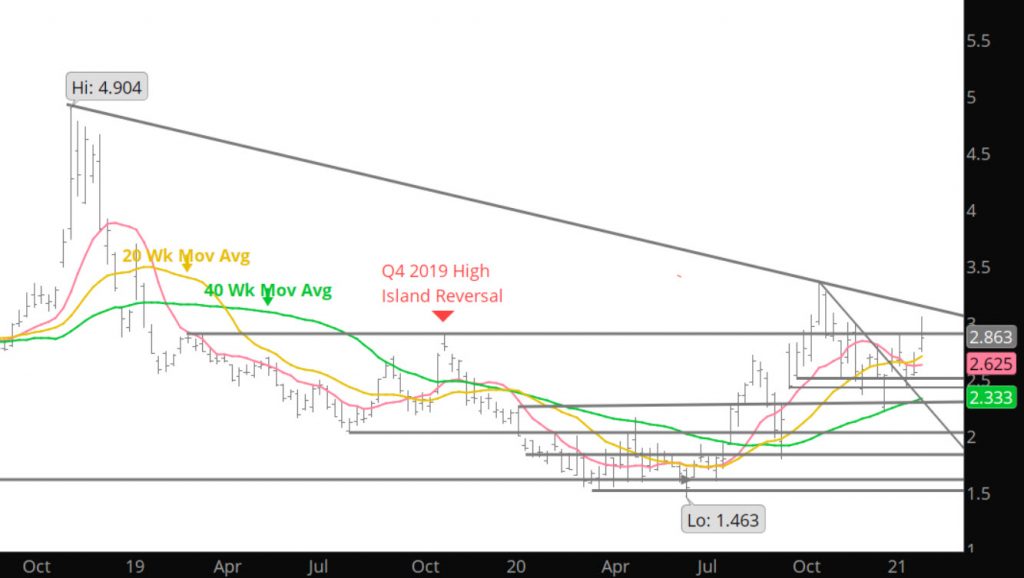
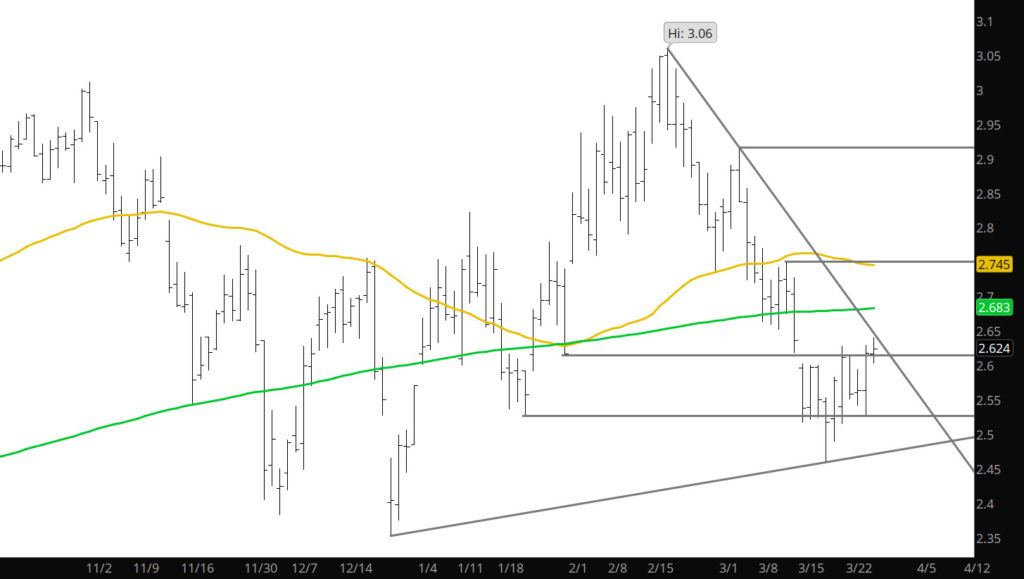
The rally to the February high confirmed intermediate – long term resistance. This zone remains between the October high, 3.396, the November high,3.393 and the February high, 3.316. Prompt gas now needs to define (or redefine), support as discussed in the Daily for the last two weeks. Obvious conventional support is the zone between the December and January lows (2.238 – 2.414), but above that is the trend line rising from the June and September lows and the 40 – week SMA. The coming week’s value of that trend line is 2.493 (on a monthly chart basis the value of the trend line is 2.521).

Monthly Continuous

It should also come to your attention, that the speculative interests have once again entered the market on the declines of the last week or so. Notice in the chart below, that after remaining dormant or reducing for the last couple of weeks — they have increased positions with the recent breakdown.

To read The Daily Call you must be a subscriber (Current members sign in here. ) Start your subscription today.
Second Week of Weakness

Weekly Continuous

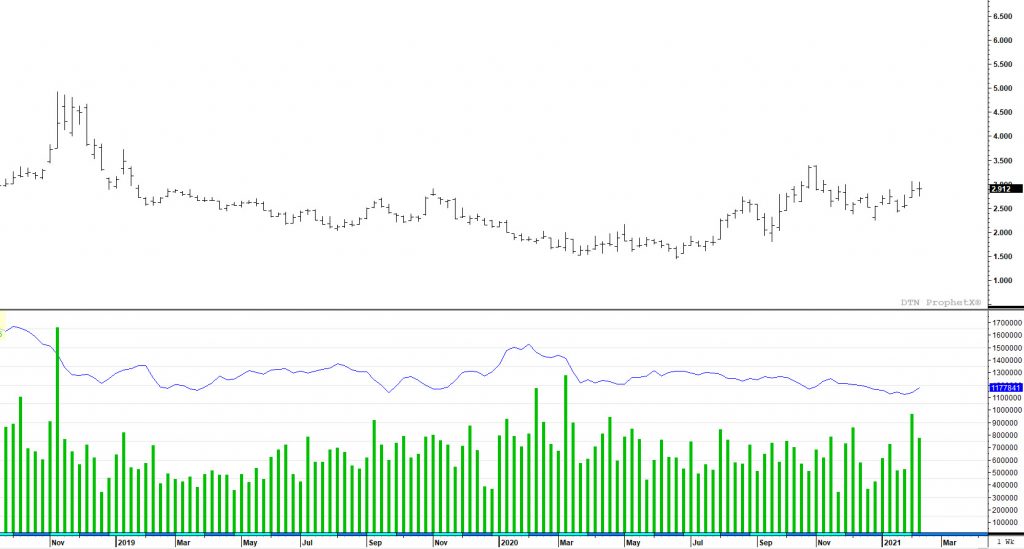
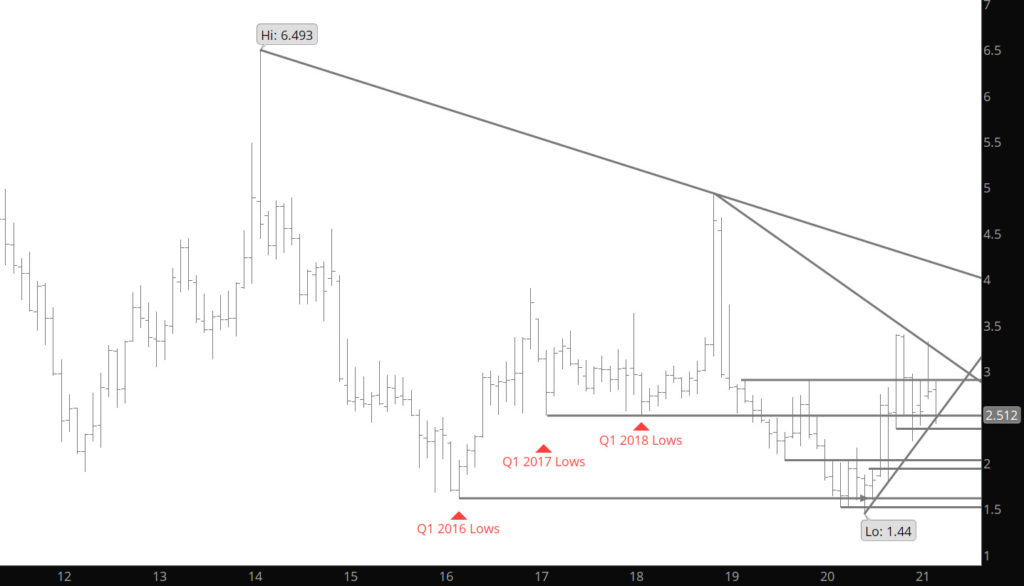
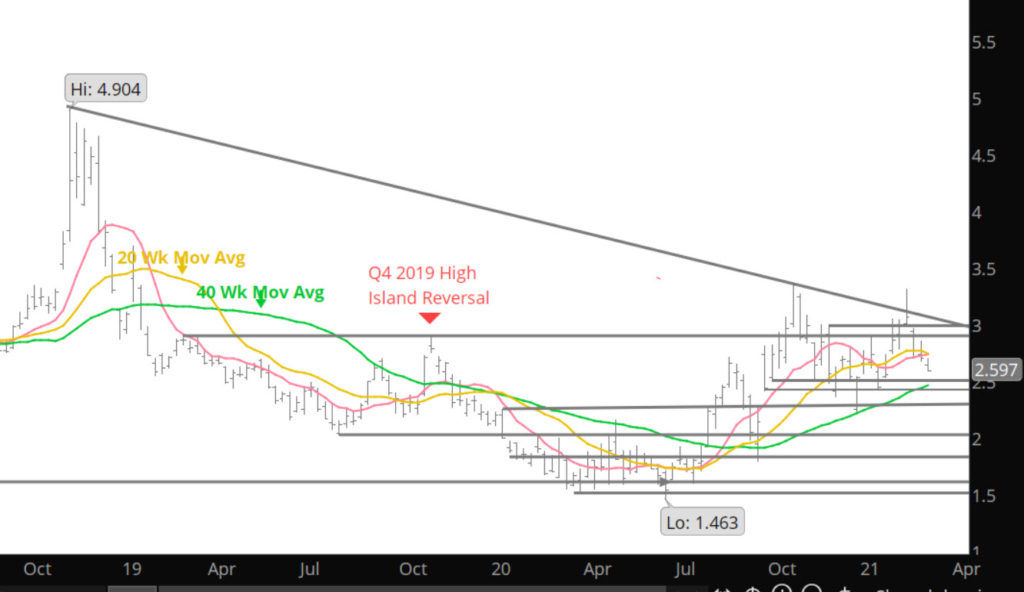
Have discussed in the Daily about the market wanting to test and eventually define the low end of the range trade that will develop (it has for the last few months). Last week was a start to develop a low — not sure it is over as technical points to further declines. Prices have now set two consecutive weeks of lower closes which is bearish but the declines of those weeks have occurred on much lower volume and declining open interest. Looking at the chart below — significant volume and open interest characteristics in this weekly continuation chart shows the volume spike that accompanied trade through the December – January highs, but perhaps more important the change in open interest. Total open interest had steadily declined since early November (nine of ten weeks) but then increased for three straight as prompt gas rallied. Increasing average daily volume and open interest along with price is a substantial technical positive. During the price weakness of the last two weeks both declined.

Weekly Natural Gas with Volume and Total Open Interest

Of additional input is the changes as to what group has been selling into the recent declines- It should also be noted that the producer community has awakened to the capacity of hedging future prices. The chart below identifies the level of selling forward production as reported to the CFTC.

To read The Daily Call you must be a subscriber (Current members sign in here. ) Start your subscription today.
2nd Lower Weekly Close

Daily Continuous

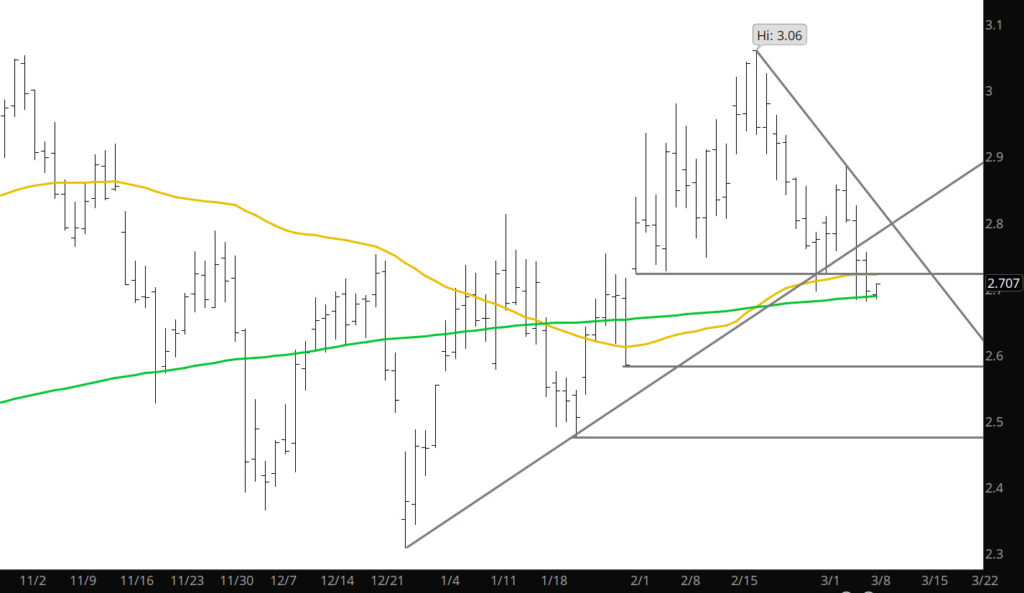
The market seems to be wanting to define a low to, what is likely, the new range and two daily tests of $2.69 and just below. Early trade on Sunday night does not indicate any early preference. The declines last week stopped at support from the 200 day SMA of the April contract (see below).

Spot April Contract

This week will likely provide indication whether this is serious support zone and the lower end of the range.

To read The Daily Call you must be a subscriber (Current members sign in here. ) Start your subscription today.
March Settlement – Highest of Q1

Weekly Continuous

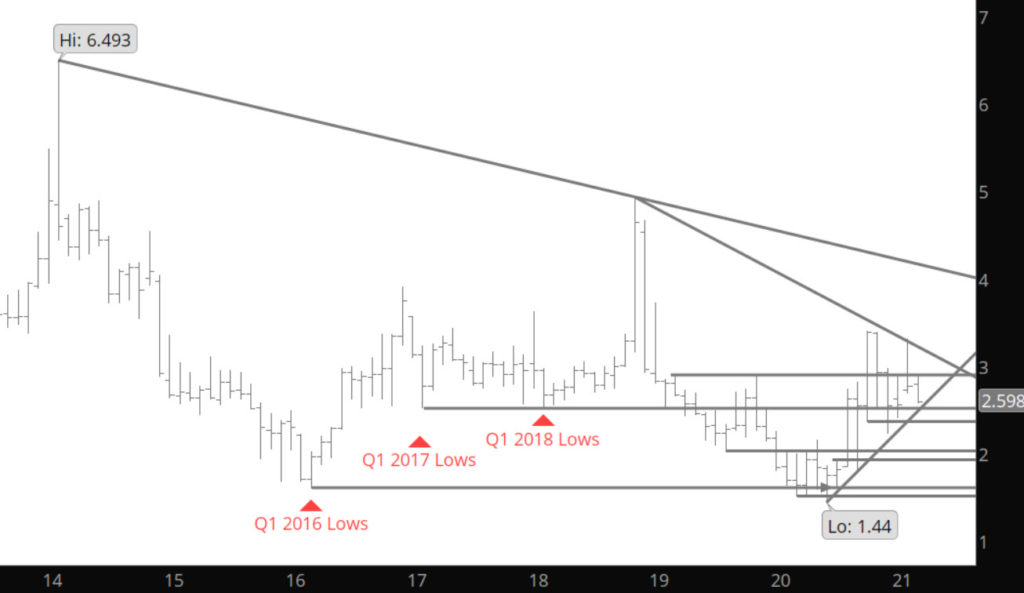
Of the last thirty years, there has been five other years that March settlement was the highest of the Q1 (historically weak period) months — ’03, ’05, ’07, ’08 and ’13.  In that 5 year sample only March ’03, which went off the board at 9.133, was the highest settlement of the year.  Multiple monthly settlements exceeded March’s in the other four years, higher Q2 prices were traded in all and all eventually traded to highs higher than that of the previous year’s Q4 high. March settlements were part of an uptrend that had begun during the spring or summer of the previous year and had not yet entered its ending phase.  If you recall, I mentioned history last fall about the strength of the Sept contract during August from a historical perspective. Being honest, ’13 was in the group mentioned about the perspective for higher trades in winter and the highs were set in Feb ’14 after that strong Aug showing. The market did set a “high” in Feb this year but with the differed months continuing to show strength– I am not convinced that the rally is over.

Monthly Continuous

Support:$2.764, $2.74, $2.65, $2.373$2.356,$2.255-$2.176
Minor Support: $2.71, $2.60-$2.554,$2.483, $2.162
Major Resistance: $2.98-$3.05, $3.082, $3.316-$$3.396, $3.486
Minor Resistance:$3.172

To read The Daily Call you must be a subscriber (Current members sign in here. ) Start your subscription today.
Price Gains Do Not Hold Through Week

Weekly Continuous

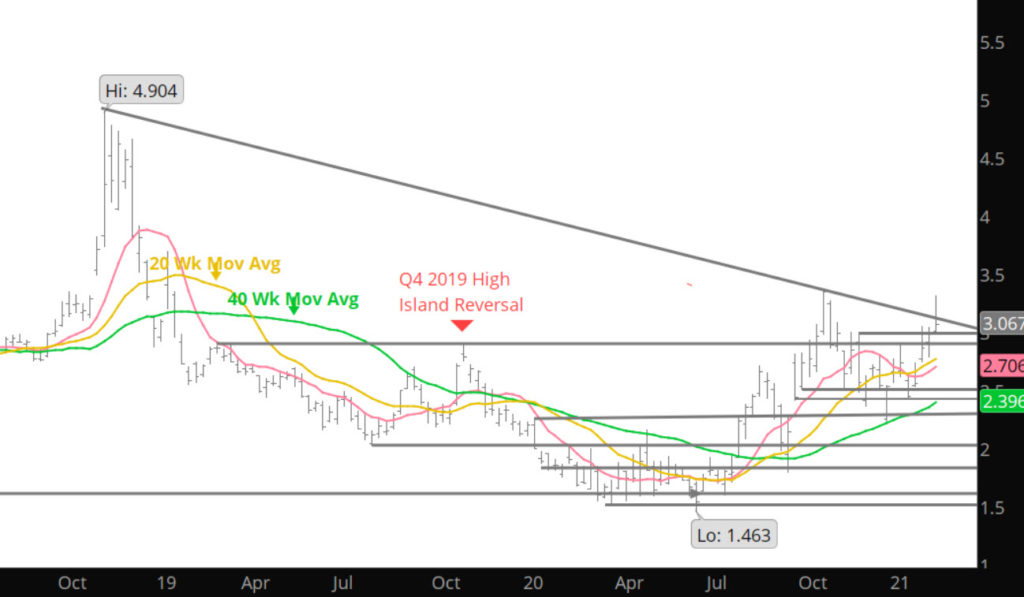
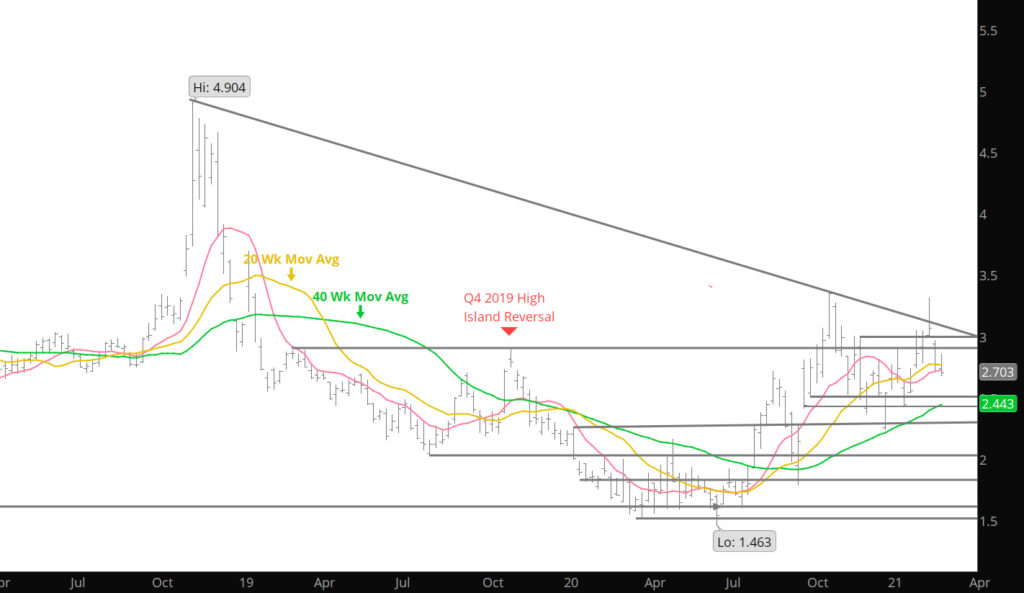
Price exploded out of the recent range trade last week, primarily fueled by the weather conditions. Breaking above the high end of the range between $3.00-$3.05 only to challenge the highs from last November and then retracing back to the old resistance area at the close. Still, prompt gas finished higher for the seventh time in eight weeks. While closing above the historically important January high- March extended the rally to test its October and November highs. The now soon to expire contract retreated from that resistance but held short – term moving average support and on a closing basis the daily downside reversal highs of 02/05 and 02/11. Prompt gas ended the week only a couple of cents above where it began…3.069 v 3.046, but with increasing volume and open interest. Price, volume and open interest moving in the same direction suggest that the uptrend is sustainable likely to be extended. Further evidence of sustaining this rally is offered by another gain in the coming summer strip that closed nearly a dime higher at 3.050. This is above highest close during October rally. Unless usually March gas gives up a significant share of this week’s gain over its last three trading days, expiration will be above the highest settlements of Q4 (November 2.996, December 2.896).

From a technical perspective, the October high is critical. Failure to trade through that high before a significant decline will not doom the bullish bias trend (discussed here in the past)but will suggest the likelihood of the perhaps long period of a trading range until prompt gas is able confirm another higher low . On the other hand- a low lower than the December low would indicate that a renewed downtrend is in progress.

To read The Daily Call you must be a subscriber (Current members sign in here. ) Start your subscription today.
Market With Some Changes within Defined Range

Weekly Continuation

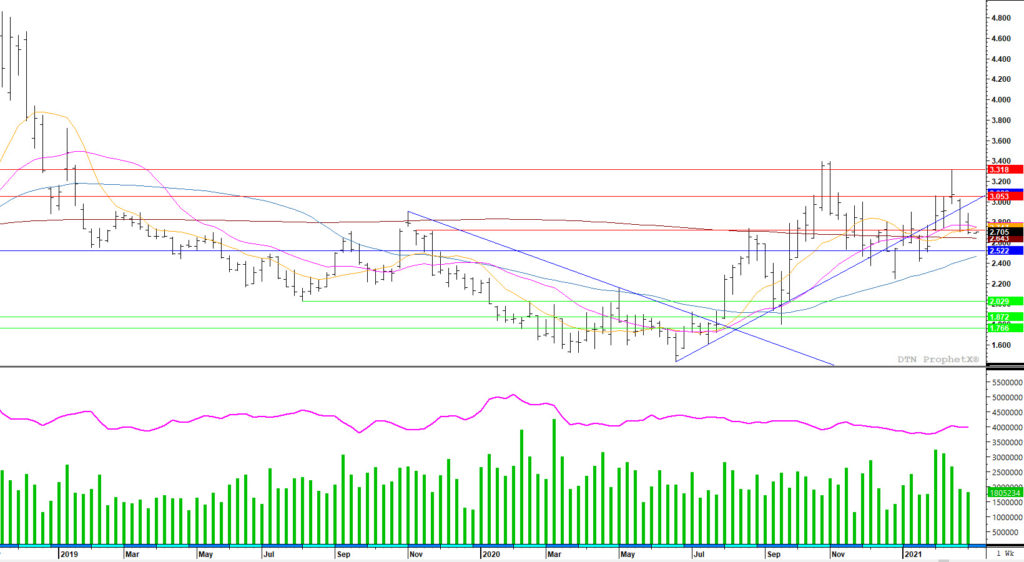
Last week’s trade was “inside” the prior week’s range and the nearly identical open and close.  Prices continue above the 10, 20 week SMA, on a closing basis for the last two weeks. Resistance is clearly defined by the high of last week and prior week.  If that resistance is overcome expect a test of three weekly highs March traded between 10/19 and 11/02 (3.318, 3.320 and 3.316). Short of that break out event- expect the range trade to be re-in forced between $2.70-$3.00.

Weekly Continuous with Volume and Open Interest

Starting to see some confirmation of the stronger prices as the total open interest and volume has gained over the last two weeks as prices have risen. Have discussed over the last two months about the bias change (bullish) that commenced after the multi-year low that posted at the end of June. Those discussions have centered around the series of higher high and higher lows. One element that has been lacking was the market confirming the bias change with the volume rising and open interest rising simultaneously. The volume two weeks ago was the highest since last March followed up with a strong volume last week. Both those weeks were met with gains in total open interest. Of greater interest is source of the gains– look at the following two charts– notice that some of the volume gains as prices rallied were associated with short covering by the speculative crowd as prices showed strength two weeks ago.

To read The Daily Call you must be a subscriber (Current members sign in here. ) Start your subscription today.
Consolidation and Continuation of Recent Trend

Weekly Continuation

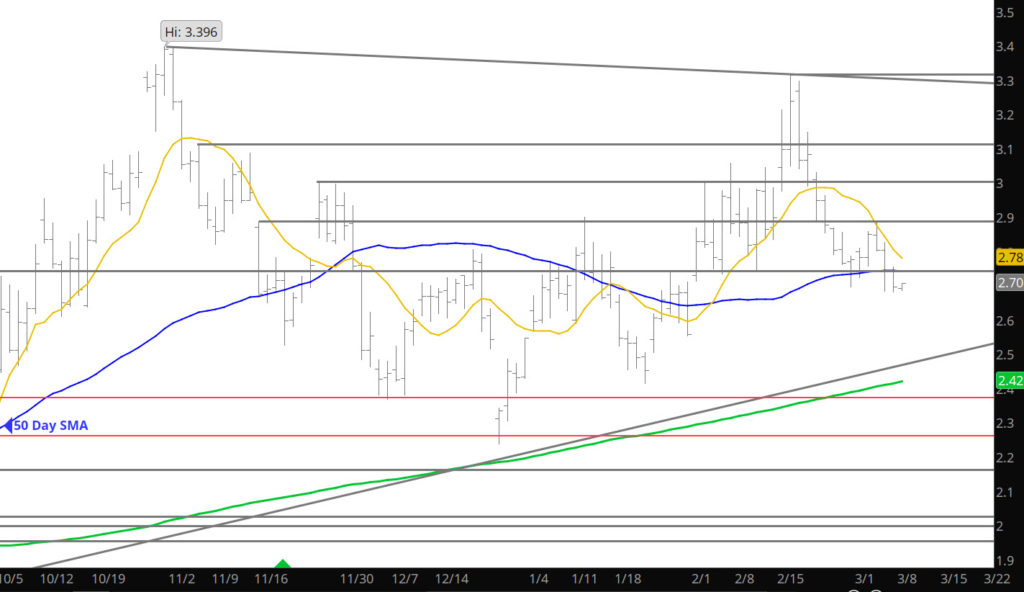
Three Friday’s ago, prompt February traded down to new lows for January.  That weakness brought an expectation of lower prices when trading resumed.  Rather than follow through to the downside prompt gas opened and left a small gap higher.  February hardly looked back before settlement .314 higher than that weak previous week’s close.  Last Friday, new prompt March didn’t give up all the expiration week gains but traded a daily reversal lower (that was discussed), dropping .146 from the day’s high and ended the week only a penny off the low.  The declines last week, with the selling, brought a similar expectation, March would be offered lower when trading reopened.  Instead, the first trading day of February began with another small gap higher (2.710 – 2.712). 

Needless to say, after last week’s weak close, expect prices to open higher on Monday, the question remains if the market has the support to close above the key resistance area around $3.00. Twice, last week, prices rallied above $3.00 only to find significant selling and resistance that sent prices down below $2.90 and into support zones. Will a third time be the charm?

To read The Daily Call you must be a subscriber (Current members sign in here. ) Start your subscription today.