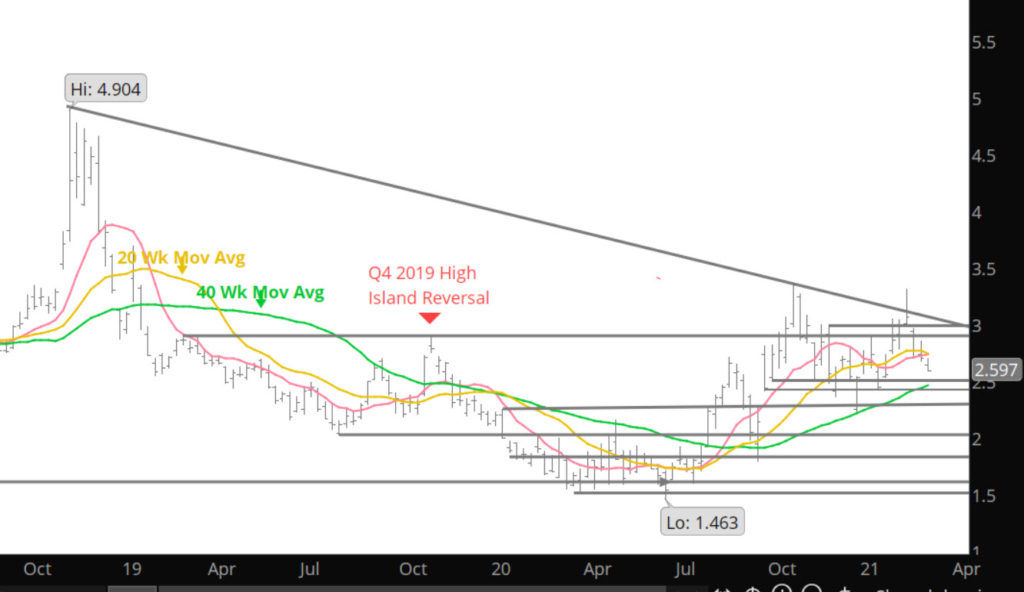
The rally to the February high confirmed intermediate – long term resistance. This zone remains between the October high, 3.396, the November high,3.393 and the February high, 3.316. Prompt gas now needs to define (or redefine), support as discussed in the Daily for the last two weeks. Obvious conventional support is the zone between the December and January lows (2.238 – 2.414), but above that is the trend line rising from the June and September lows and the 40 – week SMA. The coming week’s value of that trend line is 2.493 (on a monthly chart basis the value of the trend line is 2.521).
Monthly Continuous
It should also come to your attention, that the speculative interests have once again entered the market on the declines of the last week or so. Notice in the chart below, that after remaining dormant or reducing for the last couple of weeks — they have increased positions with the recent breakdown.