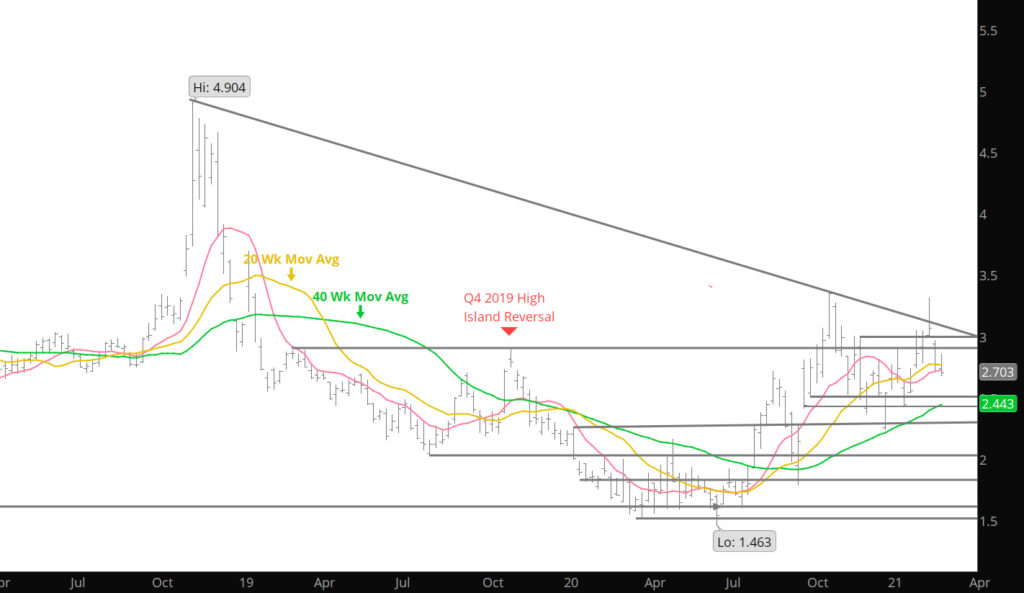
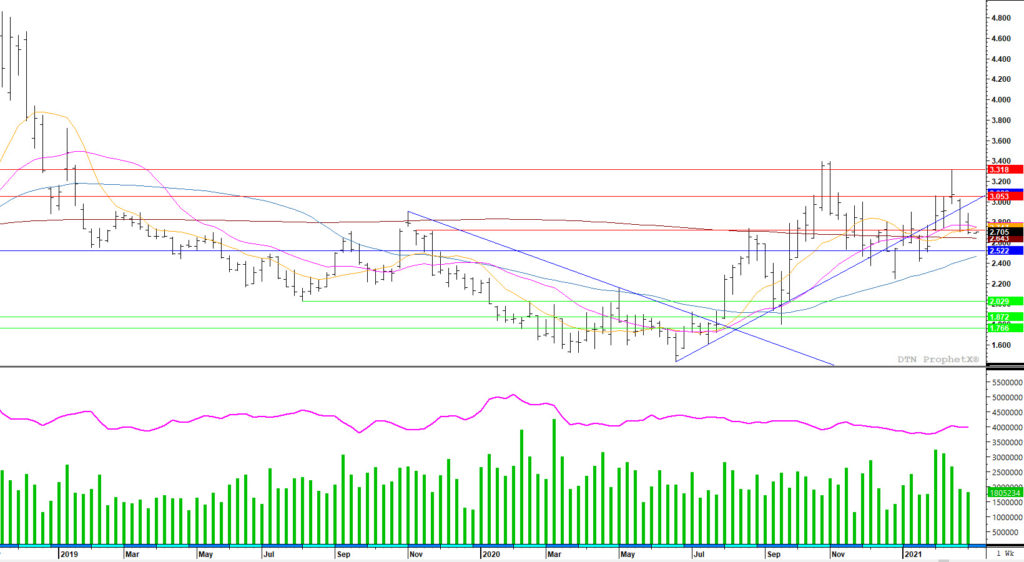
Have discussed in the Daily about the market wanting to test and eventually define the low end of the range trade that will develop (it has for the last few months). Last week was a start to develop a low — not sure it is over as technical points to further declines. Prices have now set two consecutive weeks of lower closes which is bearish but the declines of those weeks have occurred on much lower volume and declining open interest. Looking at the chart below — significant volume and open interest characteristics in this weekly continuation chart shows the volume spike that accompanied trade through the December – January highs, but perhaps more important the change in open interest. Total open interest had steadily declined since early November (nine of ten weeks) but then increased for three straight as prompt gas rallied. Increasing average daily volume and open interest along with price is a substantial technical positive. During the price weakness of the last two weeks both declined.
Weekly Natural Gas with Volume and Total Open Interest
Of additional input is the changes as to what group has been selling into the recent declines- It should also be noted that the producer community has awakened to the capacity of hedging future prices. The chart below identifies the level of selling forward production as reported to the CFTC.