Prompt gas finished higher for a second week and the third time in the last four. Consecutive higher weekly closes have not occurred since the rally from the October low and prompt gas had not been higher in three of four weeks since the portion of the rally to the August high. Those rallies failed but failure currently will just test support zones not the declines we saw in the fall (sorry — don’t see prices to zero).
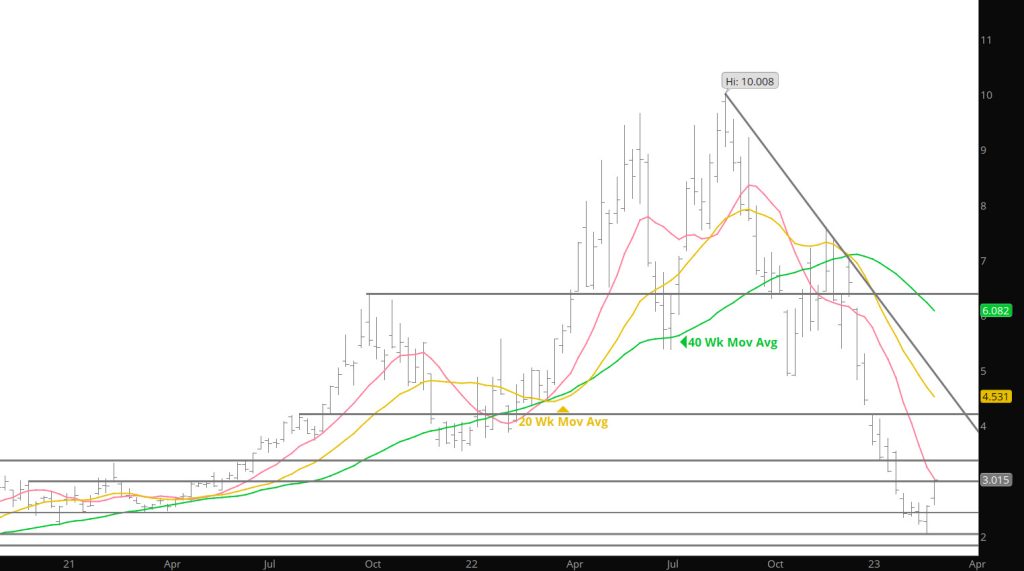
Weekly charts give useful information for purposes of hedging and term positioning vs Daily charts which are quick snapshots of what short term actions are coming. For an intermediate/long – term perspective the monthly charts are invaluable for filtering out distracting trading “noise”. For example, the June ’21 breakout through the Q4 ’20 high was an ominous warning of an extended period of higher prices. Last summer there was a warning of a different type, this one in the form of an extremely rare monthly event which was back to back “outside” months during calendar June and July (it is unusual if that occurs on a weekly basis at the least). That event was noted at the time along with a discussion about weekly volatility. Rare monthly events always send a message. The market may have sent another one by the price change during February.