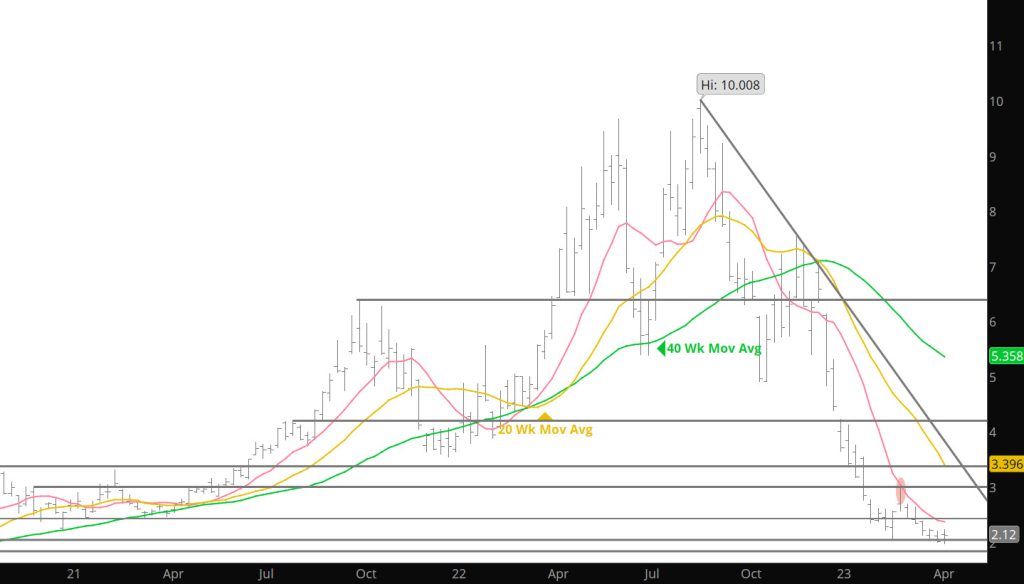
Despite an bearish outside week reversal to the downside, selling sufficient to drive the prompt through the lower extreme of the narrow zone did not materialize. The the failure to extend the decline (the low was $1.946) toward the September ’20 low ($1.795) triggered a short covering rally that left May $.103 higher for the week. That recovery from a test of such obvious and critical, support is a pretty good indication that at least for the near term May may start to look like it is running out of sellers. Technical improvement was also evidenced by the highest volume week since last since last September. Mentioning in previous analysis that weekly volume has been on balance declining since just prior to the February low and suggesting that selling pressure has been starting to dissipate. In addition, total open interest declined 38,702 contracts–the largest one week decline in the total of contracts outstanding since the beginning of the collapse from the August high.
Last week does not “announce” a trend change but rather a potential of a shift. This market’s declines are not “over” and buying dips (on a limited scale) may turn out profitable over time. If prompt gas is able to remain “inside” the March extremes during calendar April and end the calendar month higher than it began ($2.085-which stands to be possible given a boost by June’s current premium over May ($2.305 v$2.114), aggressive sellers may start to re-evaluate their beliefs.
Major Support: $2.00, $1.991-$1.96, $1.795-$1.766
Minor Support:
Major Resistance $2.12-$2.184, $2.36, $2.836, $3.00, $3.536, 3.595
