July Seasonal (post 4th) Declines On Time

Weekly Continuation

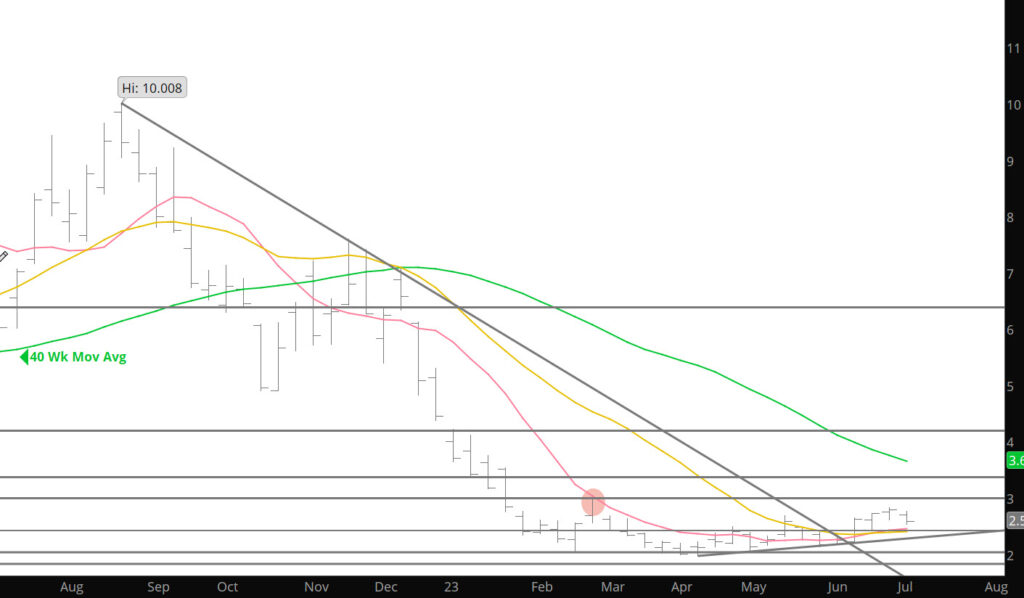
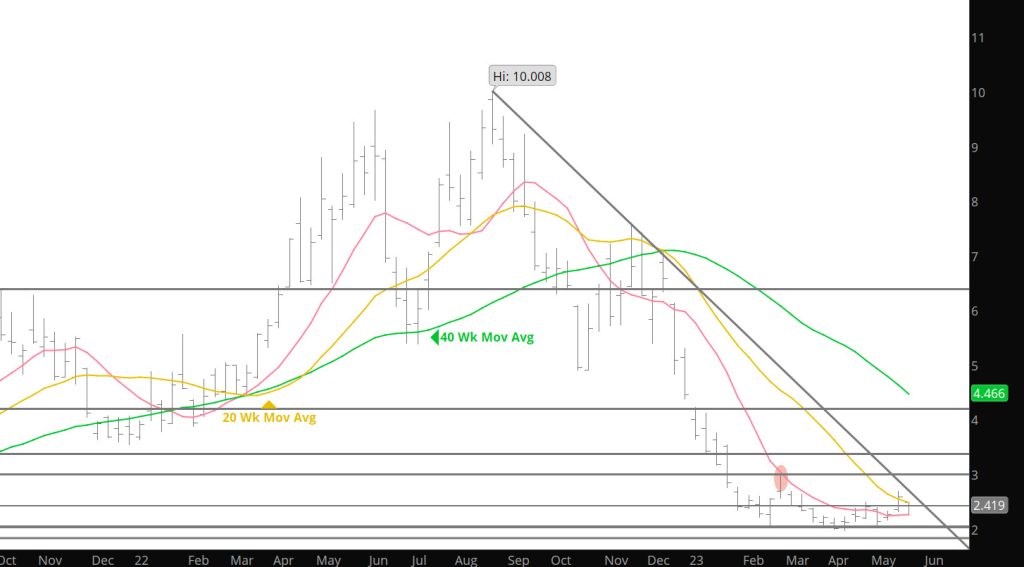
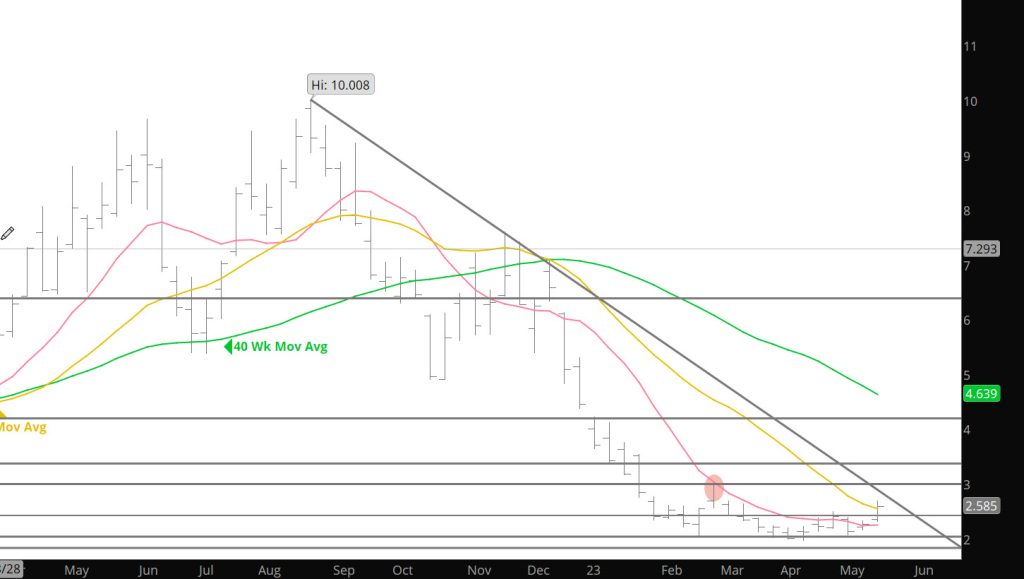
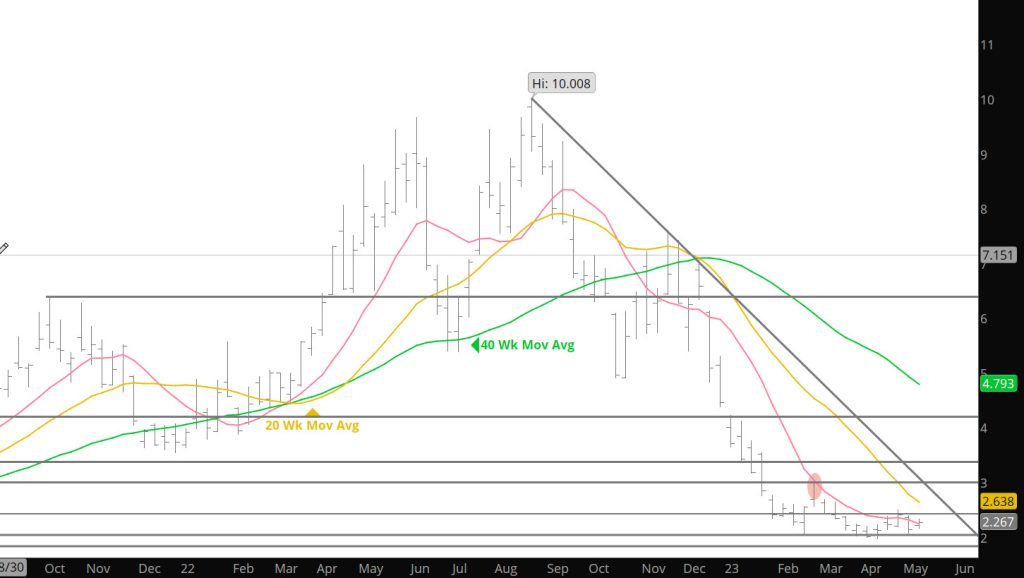
The two day rally failed at the start of the week fell a little short of last week’s high ($2.750 v $2.793), which was lower than the previous week’s high and the rally gains were quickly forfeited. With volume increasing the prompt tested last week’s low but held just above $2.536 ($2.539)…lower trade for a third straight day validated last week’s ideas of lower trade as the post – Independence Day decline was extended to $2.492.

The historically consistent seasonal decline from a late June high (measuring from the 06/20 recovery high of new prompt August), was extended to $.336 or just about 12%. That is a little more than the three and five years average declines, a little less than the average of the last ten years. While the memory of last year’s rocket ride from the post – Independence Day low (from an 07/05 low of $5.325 August ’22 rallied to a 07/26 high of $9.752) is still fresh, the recent price action is more typical of July trade. Declines should be extended a little further before sufficient sponsorship is uncovered to lift August to a somewhat higher expiration. History suggests that over the years August has settled lower than July far more often than not, but August has been higher in each of the last three.

To read The Daily Call you must be a subscriber (Current members sign in here. ) Start your subscription today.

Prices Test Low End of Support

Weekly Continuation

Declines commenced prior to holiday and continued through the week beginning, to test support areas around the $2.52 – $2.57 area. August found support at a variety of moving averages on the continuation charts and its own. On Friday the continuation 20 – day SMA was $2.563, on the August chart the 50 – day was $2.553, the 10 – week, $2.573. Just prior to the close the prompt traded through all those closely watched short – term technical support levels with very low volume (average daily volume this week was +/- 256,000, Friday’s estimate 255,000, about 100,000 contracts less than last week’s average and well below the 30 and 50 – day averages) but managed to recover enough to close above them. In addition, August held above its 06/21 reversal day low ($2.527), but the buying twelve sessions ago that was sufficient to trigger a daily reversal higher was absent . Even with August’s modest week ending recovery the close was below last week’s low, which readers may recall gives rise to a presumption that whether when the market reopens or later in the week, lower trade should be expected.

Typically, after a decline from a pre – Independence Day high prompt gas trades to a low during the second or third week of July before rallying. In bull market years the low is often earlier, in bear market years later. Given that neither characterization is currently applicable, prompt gas is, likely, confined in a trading range that began to be defined in late January and that August will spend most of its tenure trading between whatever the post – Independence low turns out to be and the late June high. The low end of the range should become defined this week .

Major Support: $2.00, $1.991-$1.96, $1.795-$1.766
Minor Support:$2.52-$2.47, $2.38-$2.26, $2.17
Major Resistance $2.816-$2.836, $3.00, $3.536, 3.59

A New Month but History Still Working
Weekly Continuation

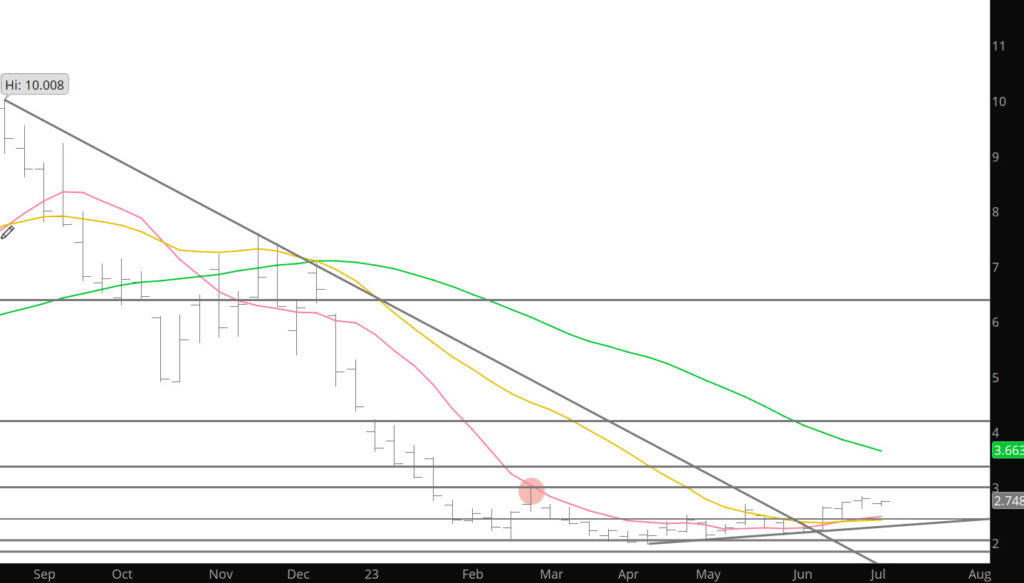
A note about the charts– having light volume and not working — the charts represent the trade from Monday and Tuesday in the data.

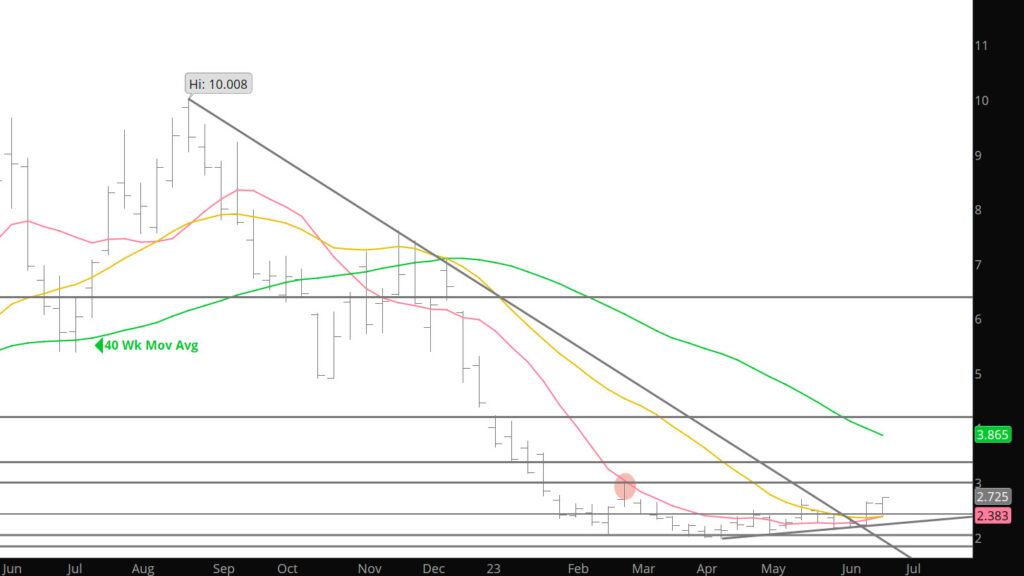
Prompt gas has consistently traded a mid – summer high during the sessions leading into the Independence Day holiday and or just occasionally a day or so after, before declining to a mid – July low. Either expiring July’s trade to $2.839 on 06/28 or new prompt August’s recovery to $2.828 on 06/30 on rather mediocre volume, fit the expectation of pre – holiday high. This does not exclude the possibility that August can’t blow through the June high on the way to test $3 and the March high at $3.027, but I am not convinced that action is coming. The average decline for the Independence Day declining seasonal, over the last ten years is about 13%, the last five years about 16%. Before the pre – holiday rally on Thursday and Friday August had fallen $.32/dt (11%) from its 06/26 high…perhaps early discounting of expected holiday weakness, but seasonal lows prior to the beginning of July have only occurred a couple of times in the last twenty years.

An average decline from the June high suggests a target of $2.40 – $2.50 which also just happens to be the value of a violated declining trend line drawn from the March and highs (currently $2.467 and falling about .03/wk). This was the key break out area discussed a few weeks ago.

You may recall that during late Q1 and early Q2 during the declines and following the March low, several requirements were discussed that if met would strongly suggest that the long downtrend from the August ’22 high was complete. First was that the gas market would need to demonstrate growing sponsorship at a higher low, as discussed here periodically, the April low was higher than March, May higher that April and now June higher than May. Secondly, prompt gas needed to test, trade through and close above the trend line drawn from the August – November – December highs (discussed here as the break out area). During week ending 06/09 prompt gas traded an extraordinarily narrow range while testing that declining resistance AND support rising from the April – May lows. The following week prompt July traded through the downtrend defining trend line, closed above it and did so with a substantial increase in volume. Third, the prompt had to follow through to the upside with declining open interest, indicating that institutions with a substantial short position were throwing in the towel. Since the close of June 6th ($2.262) through the close of June 27th ($2.763) the total number of contracts outstanding fell 157,853 contracts. That’s a lot and certainly qualifies as short covering pure and simple. The last requirement,and one that would suggest a new uptrend is beginning), is that volume and open interest increase along with price. Don’t expect that one for a while because prompt gas remains in a trading range that has confined successive prompt contracts since late January remember, just because the requirements for the end of a long – term down trend have been met does not mean that something similar to the upside has begun. Expectations are that there will be multiple short – term uptrends and downtrends within the confines of that trading range during Q3. The gas market is in a state of flux between a substantial group of participants that believe gas prices will be low forever (they speak about over supply and storage surpluses) and others like this analyst that comment that would be tooo easy. Take a look at the monthly chart of August gas (below). We have previously discussed that “outside” months are rare. There were a couple last summer and another one in March but can’t find any other period over the entire history of natural gas trading where there were three within a nine month period. It is not a coincidence that extreme volatility occurs near turning points. The chart below shows that of the last four months, trade during three of them has been through both the prior month’s extremes. That illustrates uncertainty on steroids.
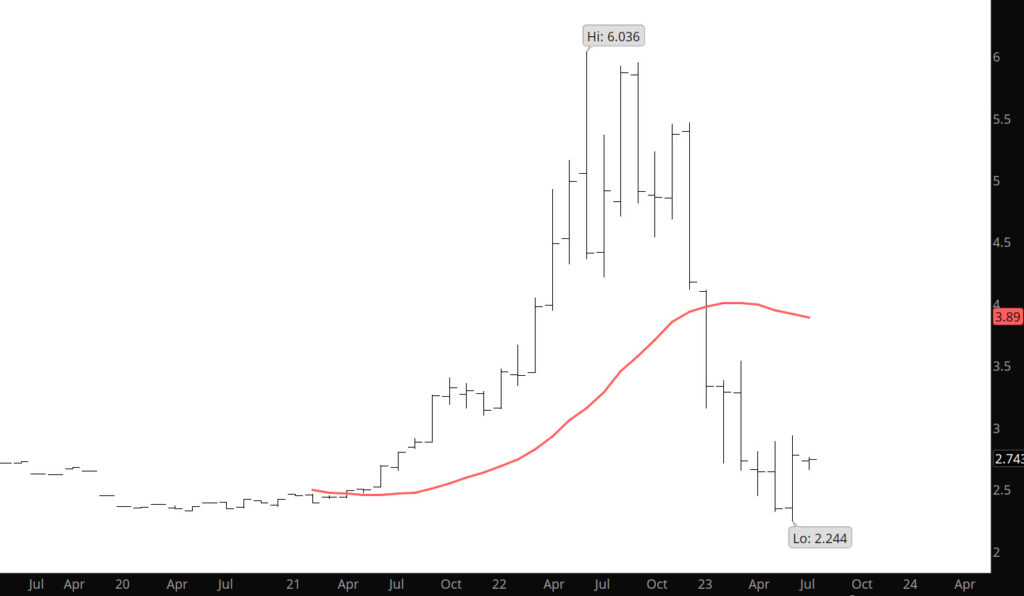
Monthly August Contract

Not suggesting that prices are headed back to $10 in the near term, but the down trend that has held the market since last fall seems to be slowly correcting its bias.

Major Support: $2.00, $1.991-$1.96, $1.795-$1.766
Minor Support:$2.47, $2.38-$2.26, $2.17
Major Resistance $2.816-$2.836, $3.00, $3.536, 3.59

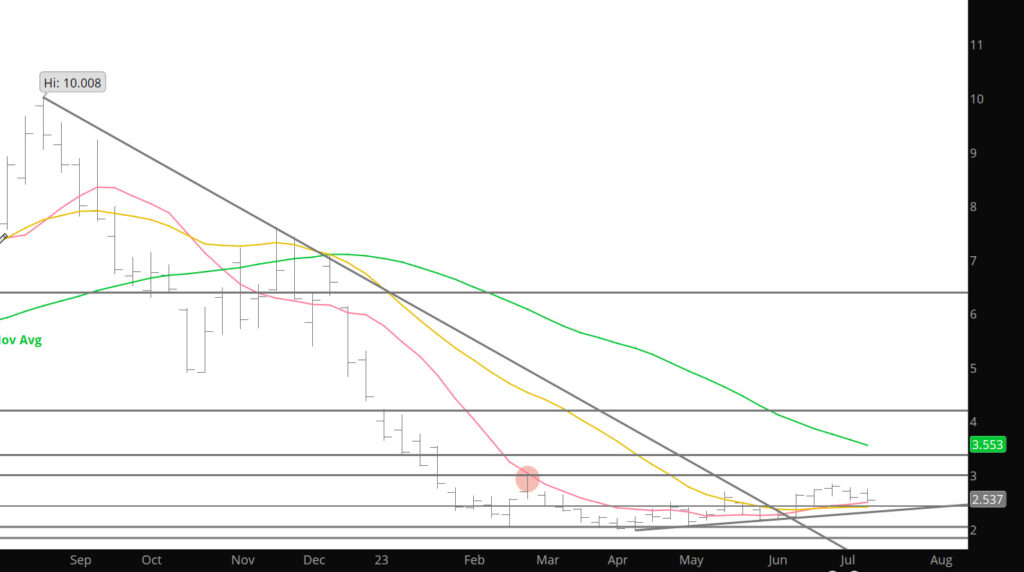
Bias Change Confirmed

Weekly Continuous

Last week, price action confirmed the previous speculated bias conversion to a bullish market with a couple of declines to support areas and finding buyers prior to achieving the support levels. In the Daily a series of higher lows confirm the Weekly chart above showing the series of higher lows in the last three months. Would suggest buying any dips in price action in the expiration week coming — but that in itself is a risky proposition. Perhaps a more conservative approach would suggest buying dips with built in sales prior to the $3.00 area as that will find significant selling on the first approach. Am traveling this week and next so the Weekly and Daily will be brief until events command more commentary. Key to this week is relax and buy dips to support.

Major Support: $2.00, $1.991-$1.96, $1.795-$1.766
Minor Support:$2.47, $2.38-$2.26, $2.17
Major Resistance, $2.707, $2.816-$2.836, $3.00, $3.536, 3.59
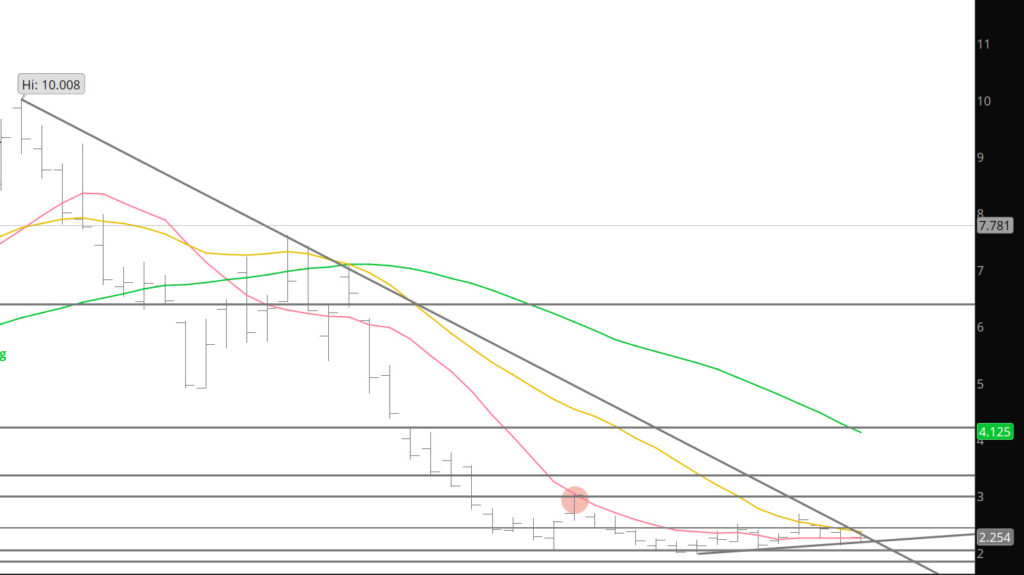
To read The Daily Call you must be a subscriber (Current members sign in here. ) Start your subscription today.

Bias Change

Weekly Continuous

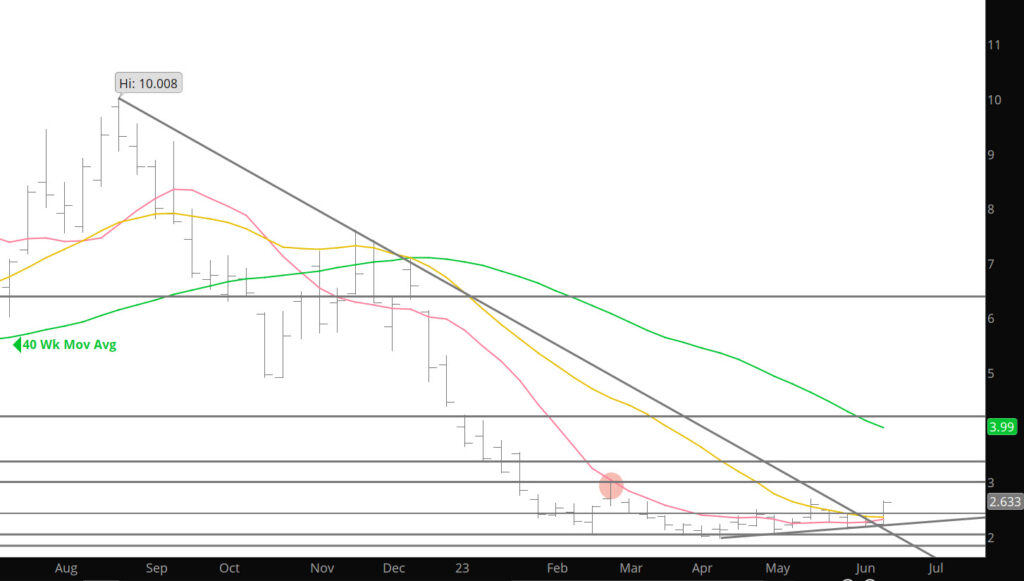
I have been dancing around the potential of a bias change occurring the gas market for a couple of weeks with the series of higher lows over the last two months, volume increasing on the positive trade days, increase in open interest in rallies and the breakout of the resistance zones that have held the market rallies for three months. Some of those elements came to fruition last week with break out above resistance in the high $2.40’s and the ensuing run up to the highs from earlier in Q2 on the continuation charts. Some of the buying was clearly short covering as the resistance areas were penetrated.

With the well defined support zone at $2.00 and below the last three months have provide a consolidation base for the current run. Now the question will be how far does the rally run prior to expiration. May high of $2.685 up to the highs for the July contract at $2.707 to $2.816 will likely provide to much selling for prices to extend much beyond.

To read The Daily Call you must be a subscriber (Current members sign in here. ) Start your subscription today.

Issues Await

Weekly Continuation

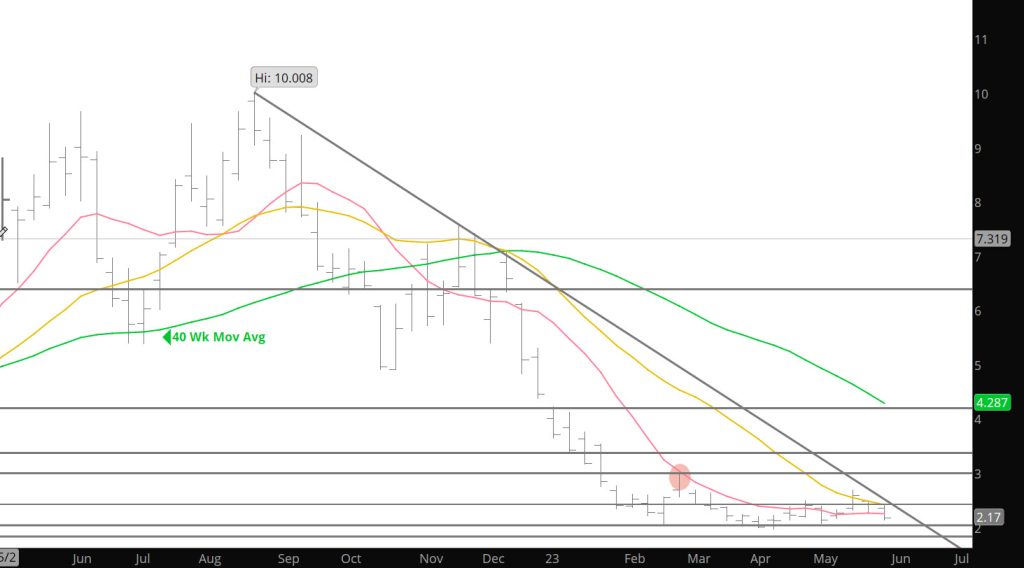
July continued to closely follow the technical/seasonal script previously discussed. After testing the trend line rising from the April/May lows last Thursday and Friday the prompt rose to challenge the short – term trend line declining from the May highs. The falling resistance trend line was too much of a sell signal and ended the rally. July gave up the gain, traded .004 through last week’s close but stopped short of testing the trend line rising from the April/May lows before recovering to close above the trend line resistance. mentioned last week, a close above the short – term trend line would trigger a test of the intermediate – long term trend line falling from the August/November/December highs. The value of that declining resistance for the past week was $2.383 and the high was$2.380. Also suggested was that the prompt’s first challenge of the resistance would fail which it did. July retraced much of the week’s gain but trading a total range of $.207/dt, and remained well “inside” last week’s range.

It will get very interesting this week when prompt July encountered the trend line declining from the Q3 and Q4 ’22 highs and the trend line from the April May lows (chart above). During the coming week the trend line declining from the August/November/December highs will intersect the trend line rising from the April/May lows. This crowding or convergence of the trend lines is not some kind of magic bullet, but both have substantial technical significant importance.

To read The Daily Call you must be a subscriber (Current members sign in here. ) Start your subscription today.

Declines Ran Out of Steam (For Now?)

Weekly Continuation

The expected, July contract gave up the record premium that had been awarded over expired June. The new prompt traded just through June’s expiration low ($2.138 v $2.143) nearly on the the value of a trend line rising from the April/May lows, before recovering a few cents. In four of the last five weeks prompt gas has settled between $2.113 and $2.181 as daily and weekly trend lines steadily made their way to convergence with current price above the February/March/April/May lows ($1.967 – $1.944 – $1.946 –$ 2.031) while volatility continues to decline.

Violation of the trend line rising from the April/May lows (currently $2.144 and rising $.005/day) will suggest another test of the support presented by calendar month lows bracketing $2.00.Violation of the trend line declining from the May high (currently $2.290 and falling about $.04/day) will suggest a forthcoming test of the downtrend defining trend line drawn from the August/November/December highs (currently $2.383 and falling $.186/week). Expect July to successful test both ascending and declining short – term support and resistance.

To read The Daily Call you must be a subscriber (Current members sign in here. ) Start your subscription today.

Base Building Continues

Weekly Continuation

New prompt July ended the week at $2.417, $.236 premium to expired June. July almost always commands premium over June but $.236 is the most generous EVER awarded. The historical fact is that July almost always gives up whatever premium is awarded usually doing so during the first week of June. Candidly, there is no clue for the reason that July has been bid with historically extraordinary premium, but history tells us that July gives it up, and judging by recent history, pretty quickly.

Since the recovery from the February low, trading just below $2, and the early March failure a few ticks above $3, we have discussed the likelihood of the construction of a range between the two extremes (even though the March low was a hair lower see chart below) . During the construction of semi – enduring price ranges rallies are accompanied by when the appropriate strategy is to ignore short covering rallies and wait to buy weakness that takes the prompt to test identifiable support zones while being wary of premium.

To read The Daily Call you must be a subscriber (Current members sign in here. ) Start your subscription today.

A Breakout For the Bulls

Weekly Continuation

Fourteen of the last sixteen years prompt gas has traded through the calendar April high ($2.529 this year) during May. The remaining two Aprils (’14 and ’19) were “inside” months. Since the prompt trade remained “inside” calendar March’s extremes during April, the April low hasn’t been violated during May since ’06. With technical indicators steadily improving, a reasonable expectation was that June would trade through $2.529, and it did. On Thursday June overcame the declining moving average and conventional resistance to trade through the April high for the fifteenth time in seventeen years doing so with some pretty serious volume.

Major Support: $2.00, $1.991-$1.96, $1.795-$1.766
Minor Support: $2.50, $2.36
Major Resistance $2.543-$2.604, $2.836, $3.00, $3.536, 3.595

To read The Daily Call you must be a subscriber (Current members sign in here. ) Start your subscription today.

Some Positive Technical Developments

Weekly Continuation

Last week prompt June fell to a new contract low as it tested continuation weekly closing support between $2.035 (week ending 04/07) and $2.106 (04/14), but volume fell again, to +/- 1,600,000, close to the same as the week of the April low, indicating that the firepower to drive the prompt back through $2 was also lacking. Opening at $2.148 June traded down to $2.140, the old support level from the week ending 04/21. That early print turned out to be the low of the week, but June tried again on Friday…trading as low as$2.147, before reversing higher accompanied by the highest volume since 04/17 when the prompt traded a nearly identical range ($2.146 – $2.314 v $2.147 –$2.335). Friday’s high volume “outside” day was a positive technical event but is more symptomatic of the final throes of the construction of a low than it is predictive of a significant extension of the rally. Substantial conventional, trend line and moving average resistance.

The consistent range that has held the market for over two months, suggests that the market is trading a “base”, that will ultimately support a significant rally, while the premium that has been awarded to deferred months is steadily compressed, suggesting in the market that its indicative that “natural gas will never rally again”. This sentiment that pervades the gas market will likely be the fuel source for the upcoming rally.

To read The Daily Call you must be a subscriber (Current members sign in here. ) Start your subscription today.