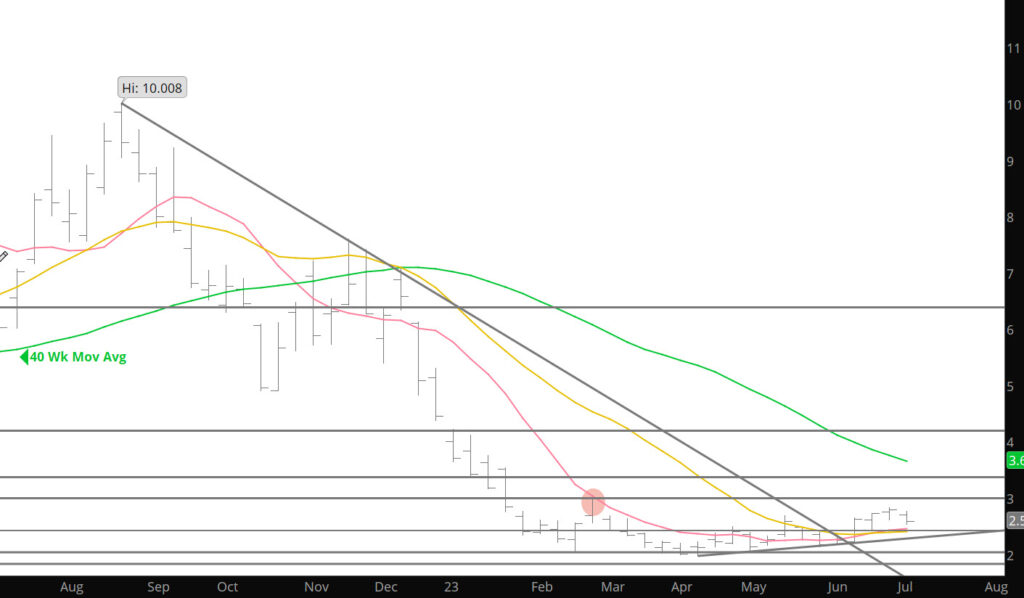
Declines commenced prior to holiday and continued through the week beginning, to test support areas around the $2.52 – $2.57 area. August found support at a variety of moving averages on the continuation charts and its own. On Friday the continuation 20 – day SMA was $2.563, on the August chart the 50 – day was $2.553, the 10 – week, $2.573. Just prior to the close the prompt traded through all those closely watched short – term technical support levels with very low volume (average daily volume this week was +/- 256,000, Friday’s estimate 255,000, about 100,000 contracts less than last week’s average and well below the 30 and 50 – day averages) but managed to recover enough to close above them. In addition, August held above its 06/21 reversal day low ($2.527), but the buying twelve sessions ago that was sufficient to trigger a daily reversal higher was absent . Even with August’s modest week ending recovery the close was below last week’s low, which readers may recall gives rise to a presumption that whether when the market reopens or later in the week, lower trade should be expected.
Typically, after a decline from a pre – Independence Day high prompt gas trades to a low during the second or third week of July before rallying. In bull market years the low is often earlier, in bear market years later. Given that neither characterization is currently applicable, prompt gas is, likely, confined in a trading range that began to be defined in late January and that August will spend most of its tenure trading between whatever the post – Independence low turns out to be and the late June high. The low end of the range should become defined this week .
Major Support: $2.00, $1.991-$1.96, $1.795-$1.766
Minor Support:$2.52-$2.47, $2.38-$2.26, $2.17
Major Resistance $2.816-$2.836, $3.00, $3.536, 3.59
