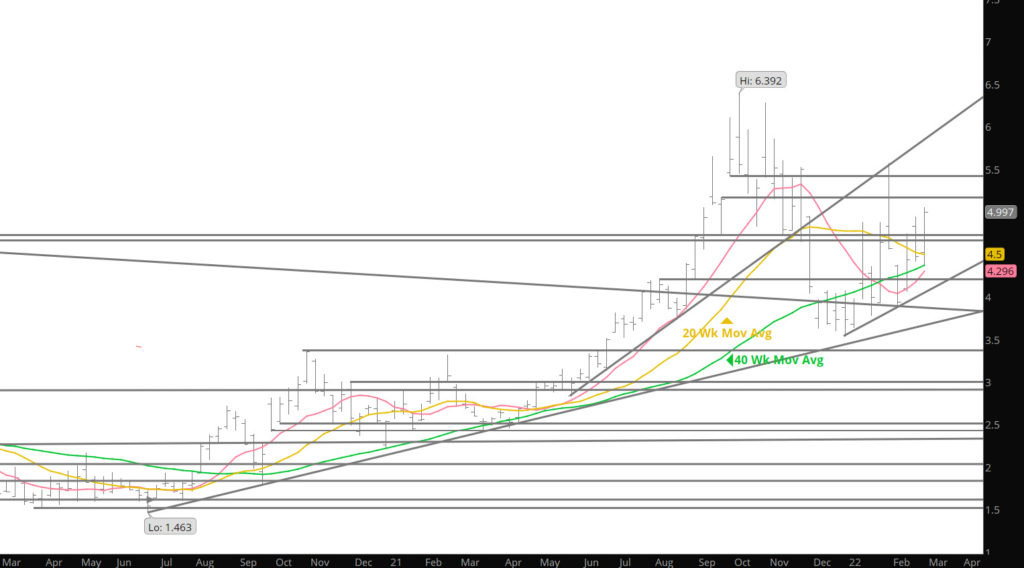
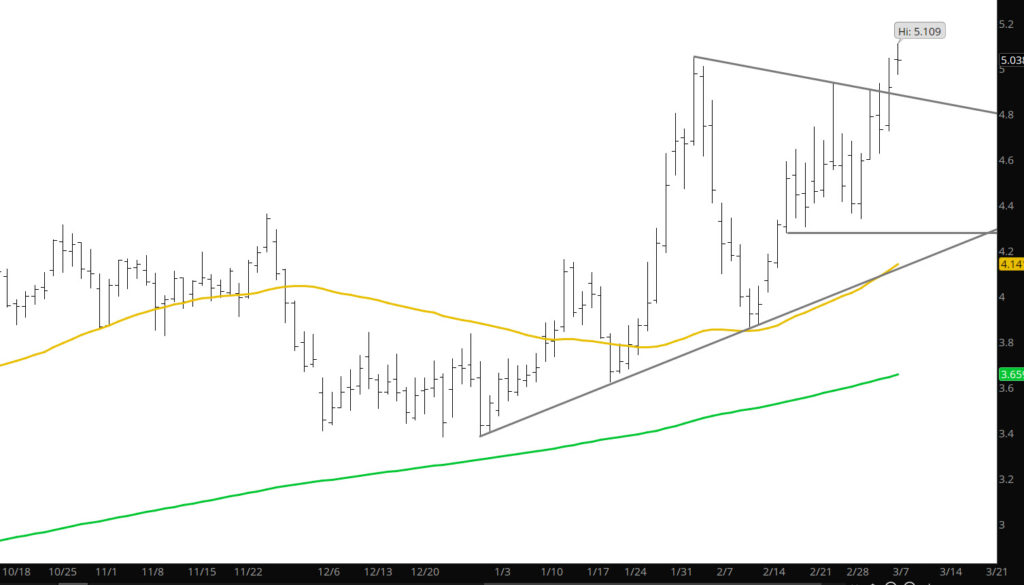
Remembering my high school Latin class (don’t ask me why) this word is used to define a long period of time which is the long period (nearly 2 years) that the gas market has been with a bullish bias. For the second time in two weeks prompt gas (the first being the last week of the March contract followed by the April), tested the intermediate – term defining 40 – week SMA at $4.42. A reversal from the support found on the April chart and the continuation moving average triggered a rally and a test of its February high (5.045 v 5.053, see chart below).
Spot April Contract
Total open interest, which declined by more than 94,000 contracts over seven trading sessions in early February to less than the total at the December 30th low (now considered the Q1 low for 2022), increased, but only modestly over the two weeks that followed. This last week the total number of contracts outstanding fell +/- 11,600 (though waiting for the final numbers from the CME) to 1,099,847, or about 10,000 contracts lower than at the end of December. The market volume was higher with total volume. Interesting to note that the total volume was higher but it was on a 4 day trade week, but average daily volume was just about unchanged with that of the last two weeks.