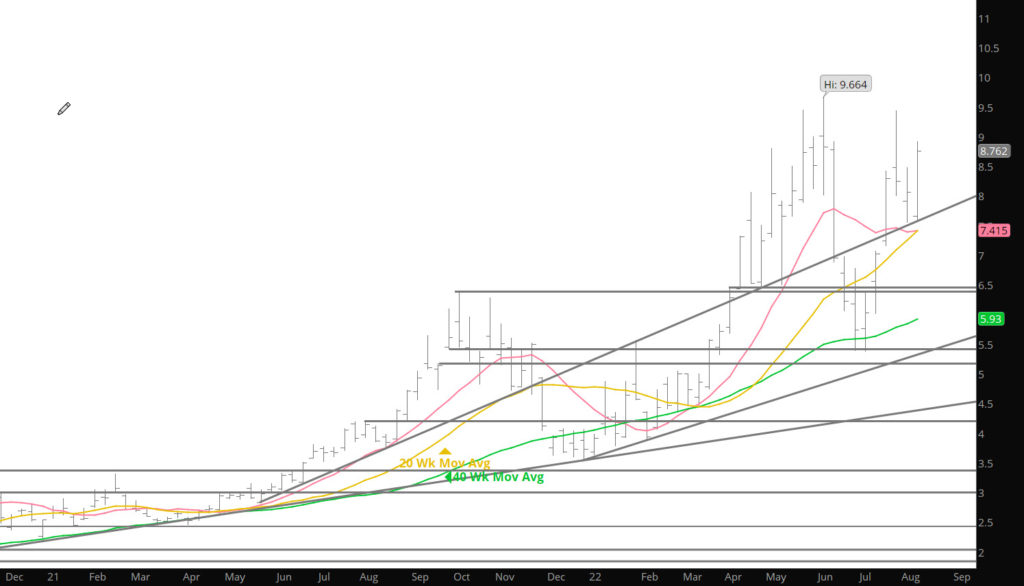
Since the June Q2 high it has been expected that prompt gas would define a summer trading range not from the July low to the June high (nearly $4 between the upper and lower extremes) and perhaps the trade in the last couple of weeks has develop a narrower range. While the question is not completely settled, the rallies of the last two weeks go a long way toward tightening the lower boundary of that range just above $7.500 and the June highs. Would continue to expect a tighter range to be defined.
Calendar August (with Sept as prompt) has historically been a period of seasonal weakness, occasionally spilling over to the first part of September. Even in the last two years when there has been counter – seasonal strength during September’s tenure the prompt traded down from highs in early August. Last year prompt September traded from $4.205 down to $3.734 on 08/19.
Volatility remains extreme–the total range traded this week was $1.387…the weekly ATR (average true range of the last fifteen weeks) is $1.392. A year ago the 15 – week average was $.271. Volume was slightly higher (25,000 average daily) but open interest continued to decline slightly. A large portion of the declines in OI was Thursday on a high volume day as prices rallied from $8.22 to the week’s high just short of $9.00 after the storage inventory release.
Continue to expect higher prices during Q4 & potentially into Q1. It is worth remembering that the rallies from Q3 lows have averaged about 74% over the last twenty years (60% over the last ten, 76% over the last five) and that Q4 highs have been higher than Q2 highs fourteen of twenty times. Q4 highs have been higher than Q3 highs in every year since ’00 except ’01, ’08, ’10, ’11 and ‘14.
Major Support: $7.55, $7.14, $7.078, $6.88, $6.754,$6.38, $6.02, $5.623,
Minor Support:$7.35, $7.41, $6.42, $5.548, $5.40-$5.45
Major Resistance: $8.95, $8.996-$9.057
