To read The Daily Call you must be a subscriber (Current members sign in here. ) Start your subscription today.
Category: Weekly Detail
In Search of a Low
To read The Daily Call you must be a subscriber (Current members sign in here. ) Start your subscription today.
Market Succumbs to Intermediate Support
To read The Daily Call you must be a subscriber (Current members sign in here. ) Start your subscription today.
May Prompt Opens With a Thud
To read The Daily Call you must be a subscriber (Current members sign in here. ) Start your subscription today.
Expiration Provides Little Bias Guidance
To read The Daily Call you must be a subscriber (Current members sign in here. ) Start your subscription today.
Expiration At the End of Week
To read The Daily Call you must be a subscriber (Current members sign in here. ) Start your subscription today.
Gas Continues Shadowing Crude
To read The Daily Call you must be a subscriber (Current members sign in here. ) Start your subscription today.
Market Rides Crude Tail
To read The Daily Call you must be a subscriber (Current members sign in here. ) Start your subscription today.
Starting a New Prompt Same Range
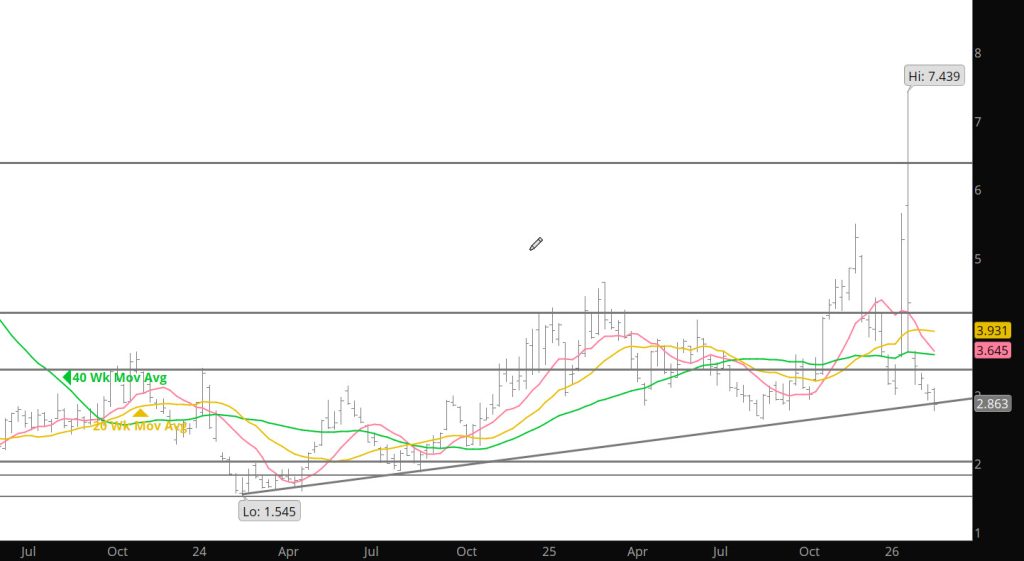
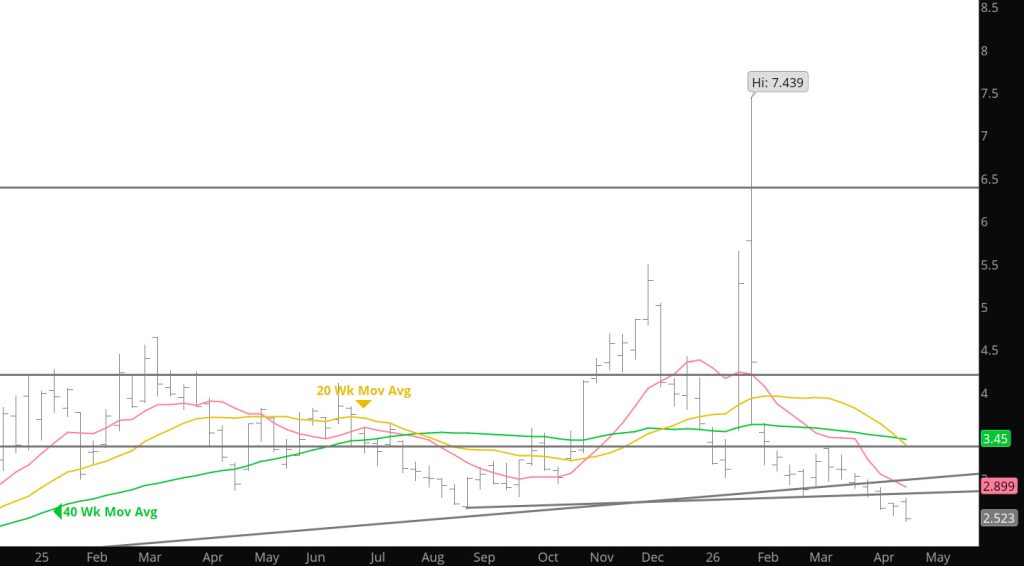
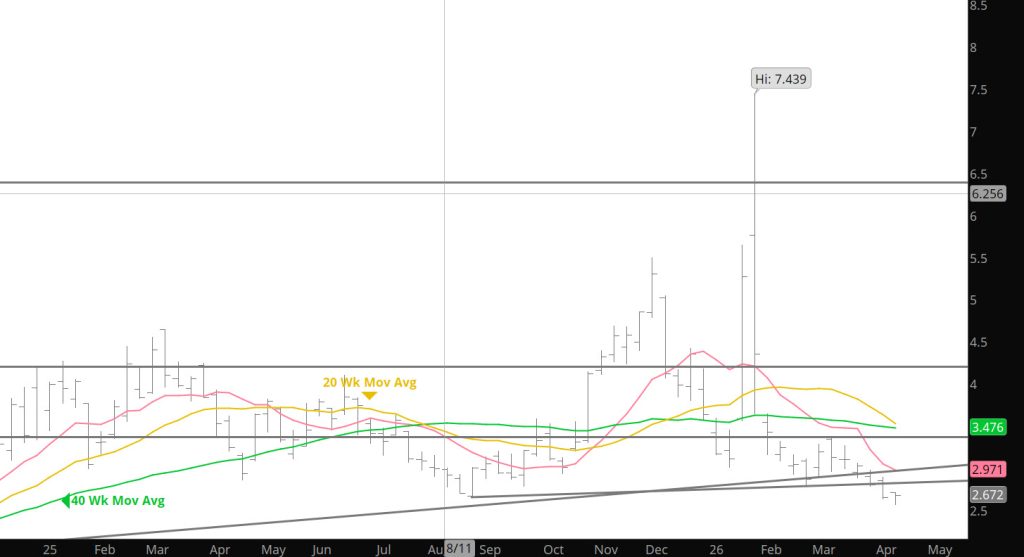
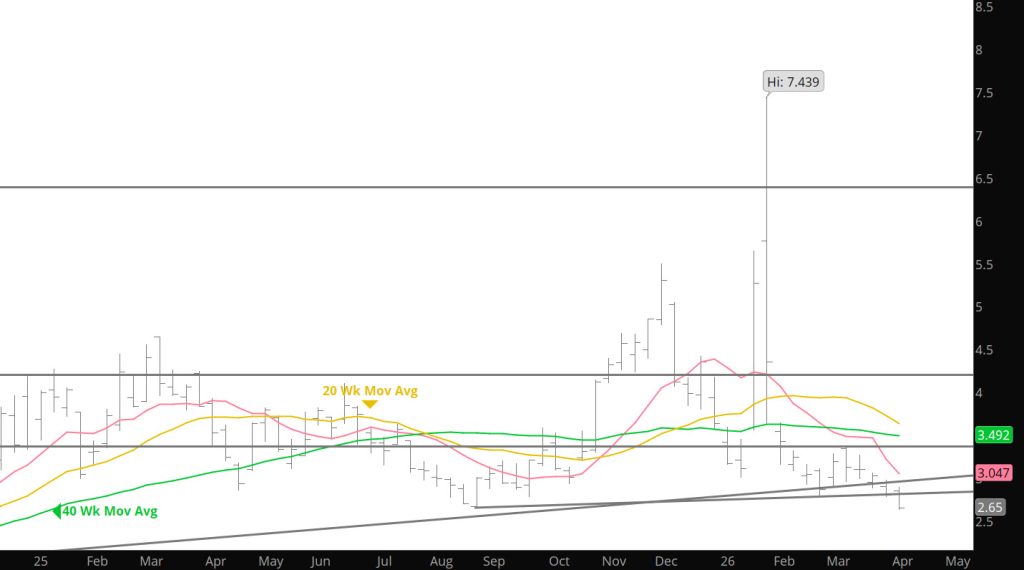
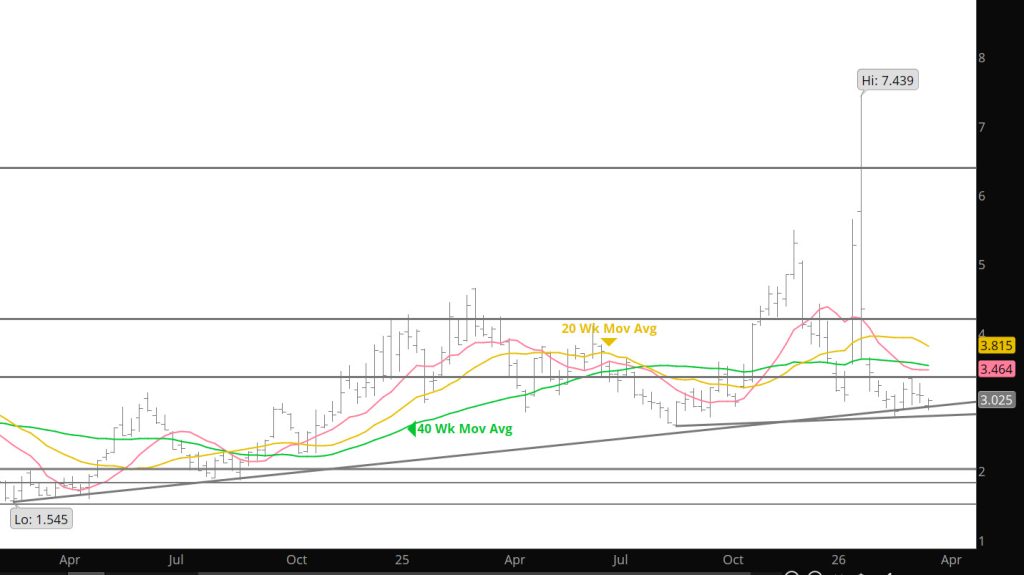
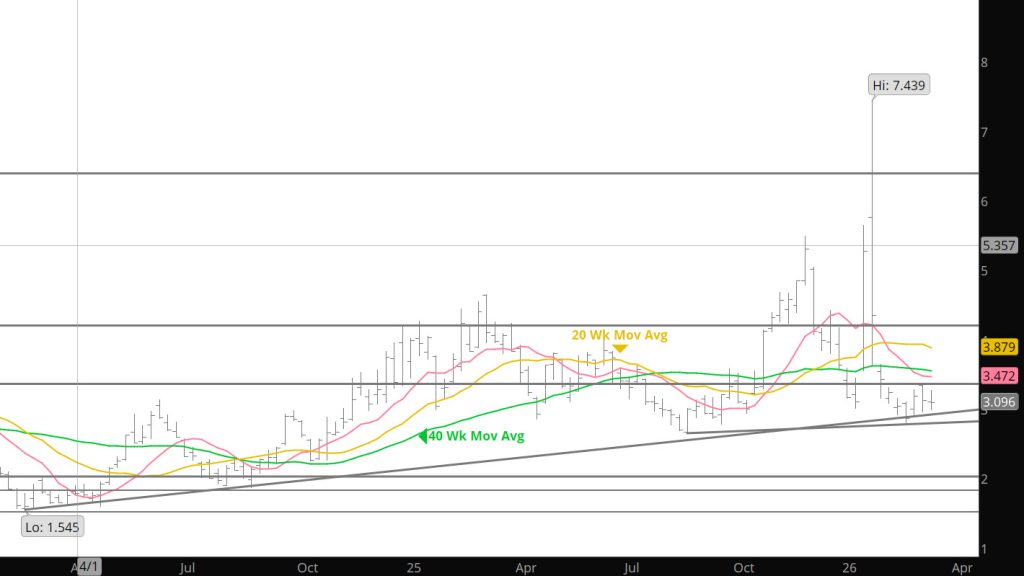
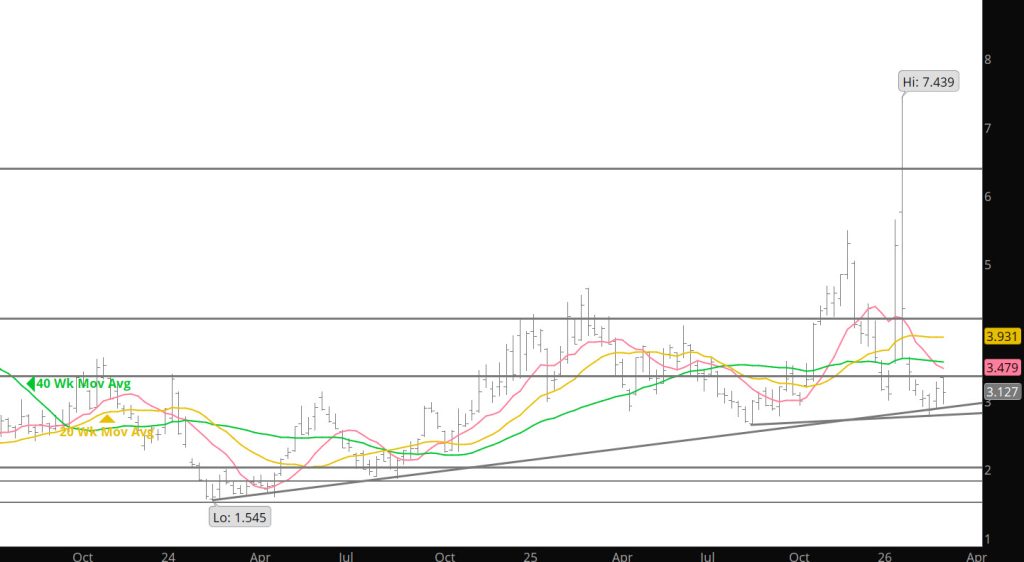
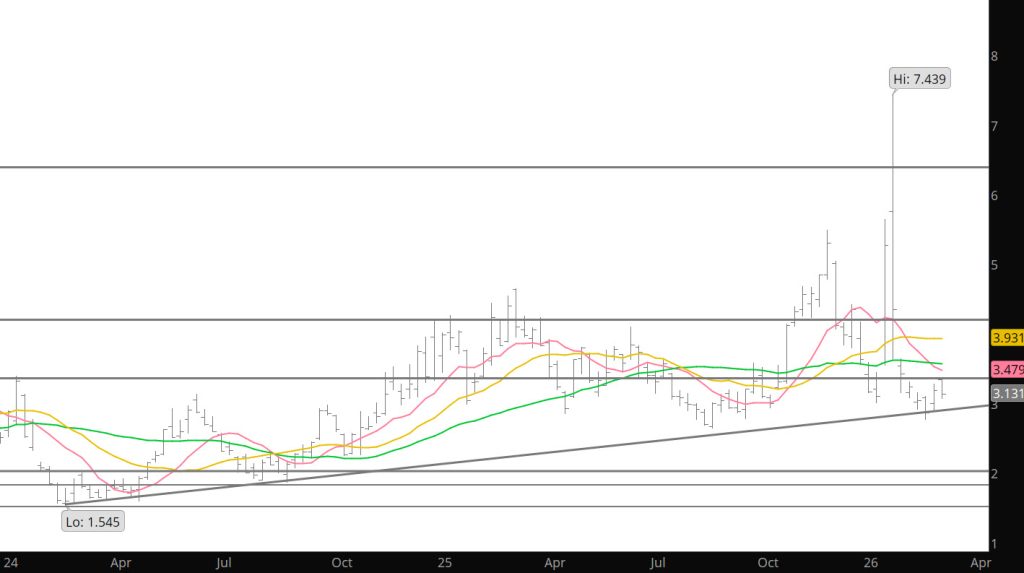
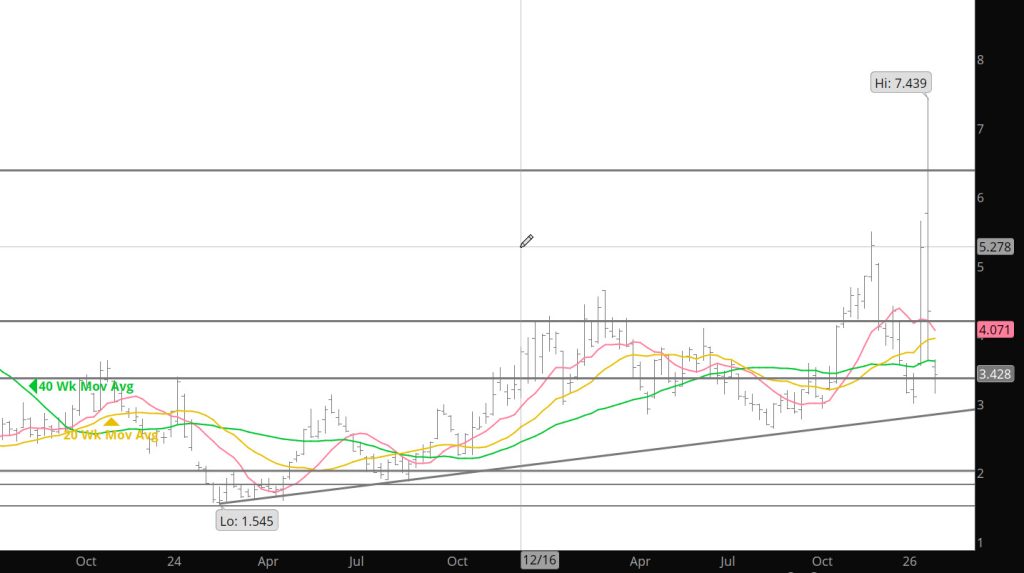
Weekly Continuous
Prompt gas and the April contract traded an “outside” week reversal to the downside to end February below the historically important January low but did so with the lowest volume traded during any week in 2026. The low turnover…which was less than half of the total traded during week ending 01/23, does not nullify the trend line violation (which still needs confirmation) but does suggest that selling pressure necessary to drive April substantially lower is at least to date, absent. Lower price lows on lower volume is a form of divergence.
The technicals are still kind of a mess but are slowly adjusting. A week ago the consensus improved a little…to neutral, this week it forfeited that improvement and reclaimed its price negative bias.: Momentum indicators…both the weekly MACD and RSI are negative with confirmed price negative divergences. Maybe that is indicating another “leg” lower, but the circumstances of the divergences…Feb’s spike higher and March’s whopper of a discount, will likely result in that being a short “leg” and that prompt gas will begin to define the lower limits of an early spring trading range. Still, the inference is that rallies will fail.
Market internals were mixed. Volume fell along with price. As mentioned earlier, a lower price low on lower volume is a form of divergence, in this case a technical positive. Open interest increased indicating an ample supply of contracts offered at a lower price, a technical negative.
Have my second grandchild coming shortly so I will keep tonight short.
Major Support: $2.87-$2.84, $2.640-$2.57
Minor Support/Resistance : $3.16-$3.148, $3.136
Major Resistance: $3.02, $2.97-$2.93, $3.787-$3.831, $4.063, $4.086, $4.593, $5.333, $5.496
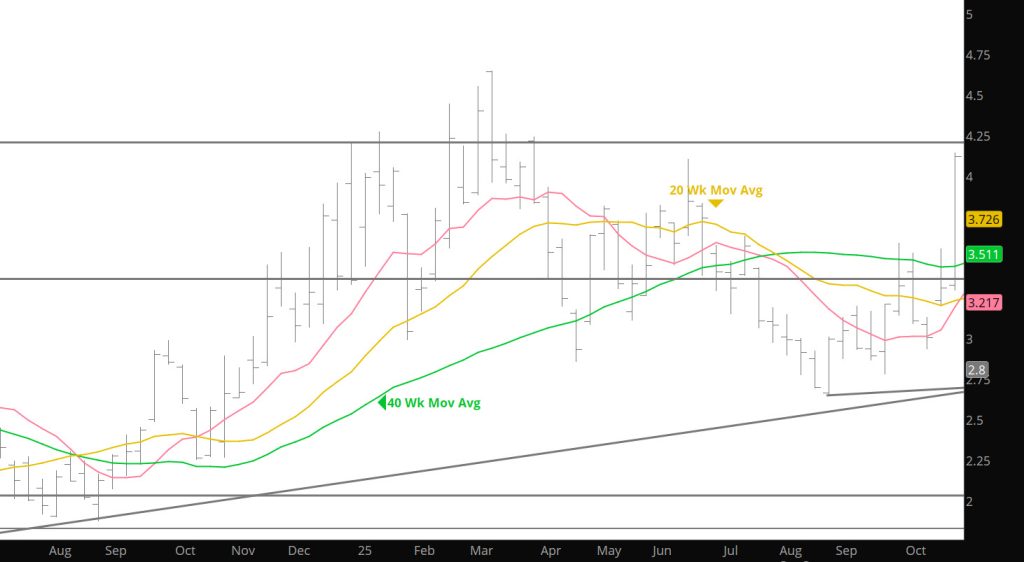
New Range To Be Tested
To read The Daily Call you must be a subscriber (Current members sign in here. ) Start your subscription today.