To read The Daily Call you must be a subscriber (Current members sign in here. ) Start your subscription today.
Category: Weekly Detail
Stalled
To read The Daily Call you must be a subscriber (Current members sign in here. ) Start your subscription today.
Rambling Through the Range
To read The Daily Call you must be a subscriber (Current members sign in here. ) Start your subscription today.
New Month Same Range
To read The Daily Call you must be a subscriber (Current members sign in here. ) Start your subscription today.
Definition of Going Nowhere
To read The Daily Call you must be a subscriber (Current members sign in here. ) Start your subscription today.
Prompt Approaching Lows
To read The Daily Call you must be a subscriber (Current members sign in here. ) Start your subscription today.
Does It Build or Consolidate
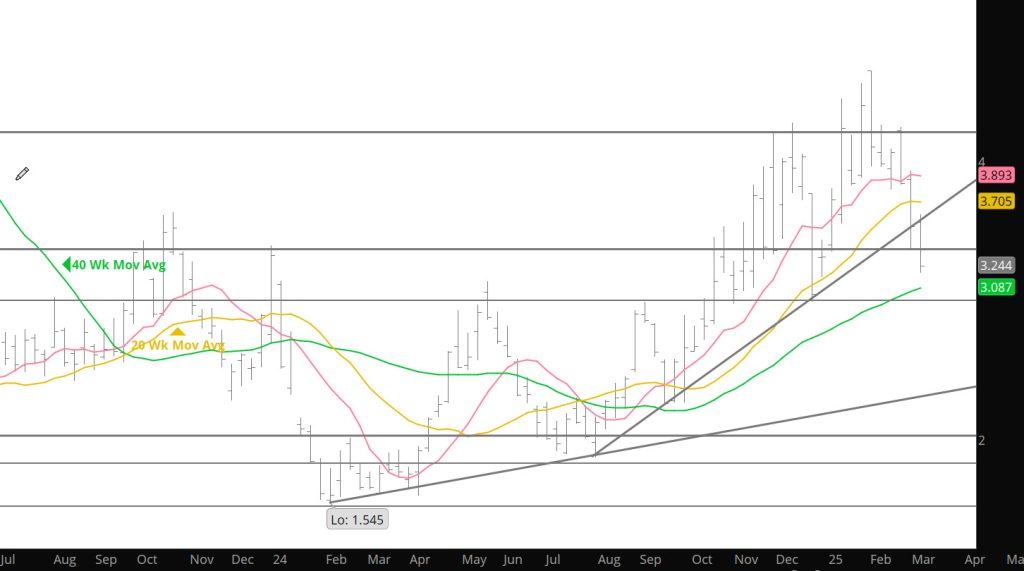
Weekly Continuation
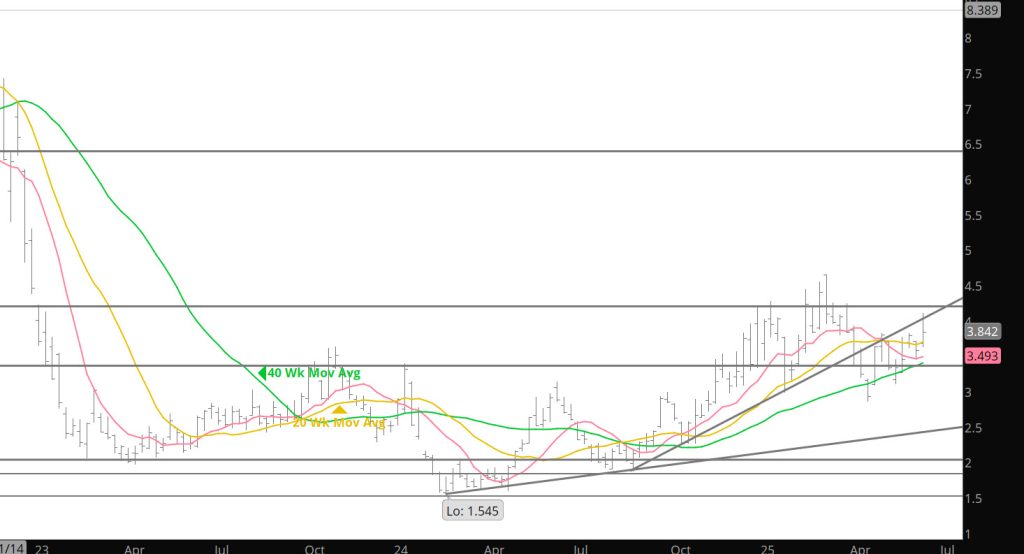
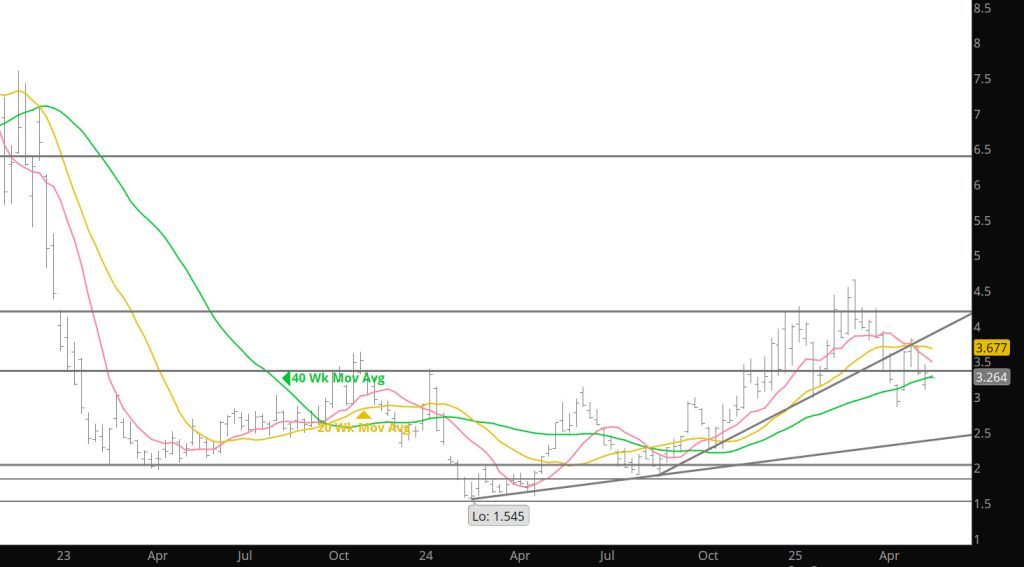
Last week’s rally was not among the things was not my immediate expectation. My view was that new prompt May would forfeit its premium and prompt gas offered lower to test rising trend line support and that technical “damage” done by the precipitous decline during calendar April (from a high on 04/03 at $4.203 to a 4/24 low at $2.858) including a weekly close below the December and January lows ($2.977 – $2.990) would render a significant recovery problematic at best.
The caveat was that in addition to vulnerability flowing from the persistent liquidation of open interest, prompt gas was severely short – term oversold and was two standard deviations below the 20 – weeks SMA for the first time in more than a year. As it worked out those conditions trumped the downside momentum that had built with six of seven lower weekly closes since the March high (the only exception was week ending 03/28 when new prompt May gained $.041). The weekly gain was the second largest for a prompt contract in more than a year ($.518 v $.565 for week ending 03/07) as June traded through layers of defined resistance as handily as it had violated similar levels of support.
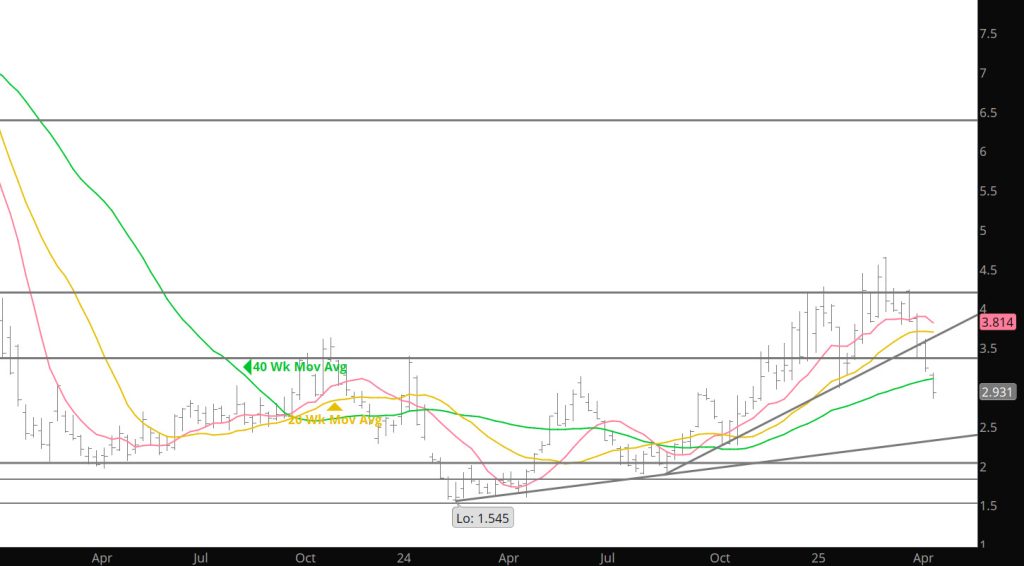
Volatility…which can be a hedgers best friend or worst nightmare, increased this week.
Given the elevated level of volatility and this week’s range traded of $.814 (including the gap) it would be reasonable to expect increased volume. That did not happen. Average daily volume fell more than 25,000 contracts and the lowest of the week accompanied Friday’s .151 gain and strong close. Open interest did increase for the first time in four weeks but only modestly…+/- 10,000 contracts. Those are not the characteristics of a sustainable rally.
The rapidity and magnitude of this week’s gain left little definable support, June’s April low ($3.007) and the calendar April low and the low of week ending 05/02 ($2.858 – $2.859), but there is a ton of identifiable resistance including the 20 – week SMA…which as of late prompt gas seems to swing to extremes around. The 20 – week is currently $3.732. A few weeks ago, the solution for dealing with a persistent elevated level of volatility (the weekly ATR is $.587 and has been $.50/dt/week or higher since the beginning of ‘25/. In early May ‘24 it was $.306),
Major Support: $2.97, $2.727, $2.648,
Minor Support :
Major Resistance: $3.628, $3.86, $4.168, $4.461, $4.501, $4.551, $4.746-$4.75, $5.03
Seasonal Tendencies Remain Intact
To read The Daily Call you must be a subscriber (Current members sign in here. ) Start your subscription today.
Holiday Shortened Week – Brings Little News
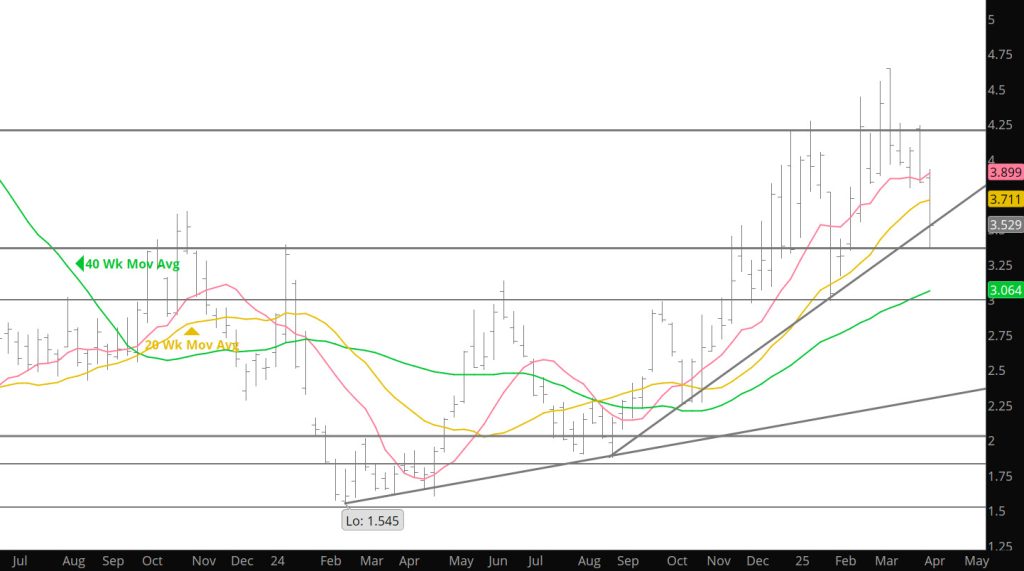
Weekly Continuous
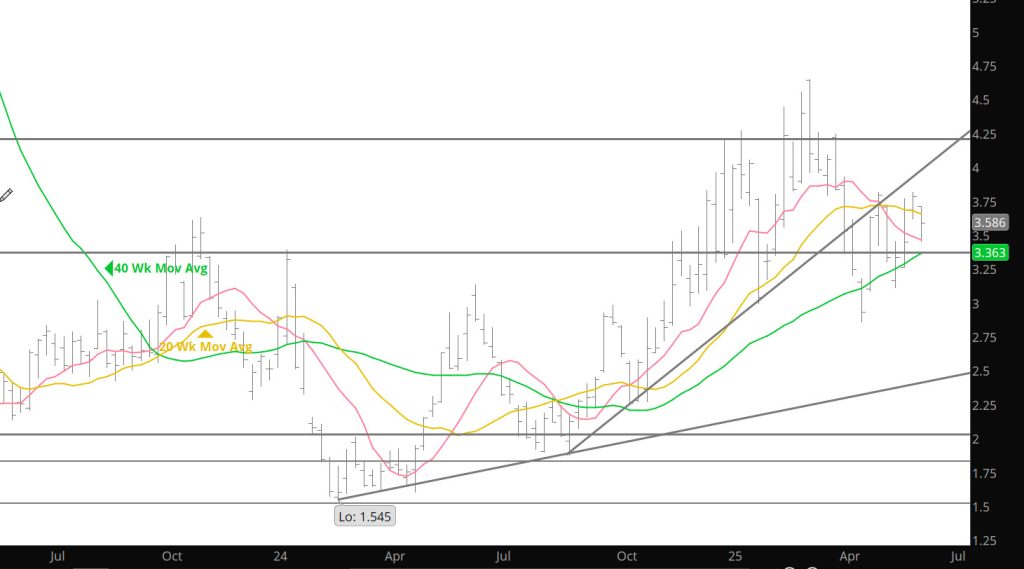
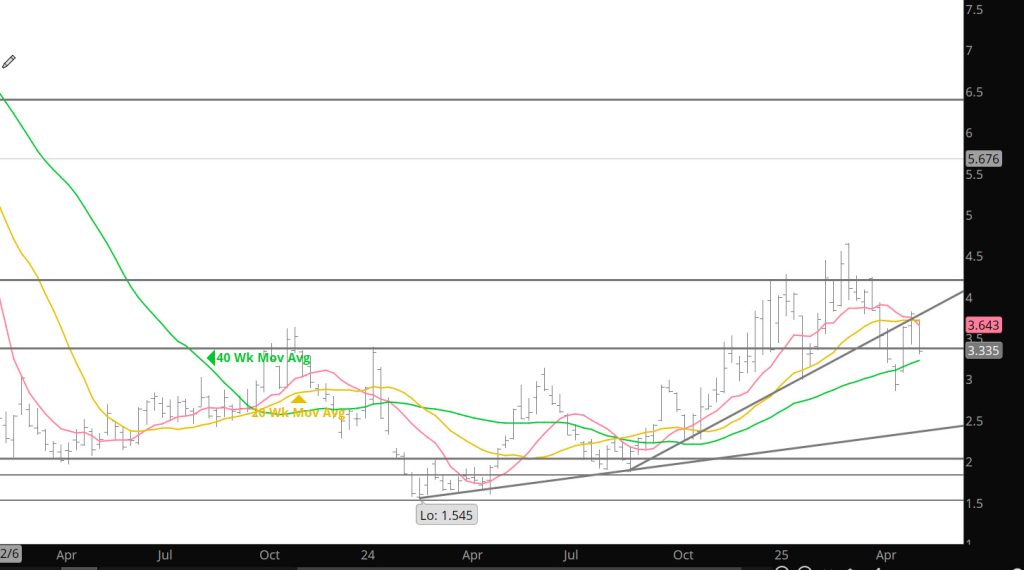
Due to an Easter celebrations — the Weekly and Daily sections of the website will be short in length. Last week provided little resolve to the previous week’s dilemma regarding bias but it was interesting to watch a lower low each of the trade days (technically a negative bias) but the open interest continued to decline each day (non-supportive of a bearish bias). Discussed here several times that volume is the energy that drives price trends and having declining volume levels last week sends a warning flag. There was not break down in prices but rather what I would characterize as a slow melt. At the end on Thursday (Friday – market was closed) there had been little resolution as to the bias for this upcoming week. The market did seem to hint at testing the $3.168-$3.11 gap in the Daily Continuous, but even if it opens down in the gap on Sunday night — the trend has been over the last few weeks, that what ever direction is established in Sunday night trade — the Monday full trading day reverses. Caution is advised.
Major Support: $3.336, $3.16-$3.11-$2.97, $2.727, $2.648,
Minor Support :
Major Resistance: $3.628, $3.86, $4.168, $4.461, $4.501, $4.551, $4.746-$4.75, $5.03
Not So Fast Bulls and Bears
To read The Daily Call you must be a subscriber (Current members sign in here. ) Start your subscription today.