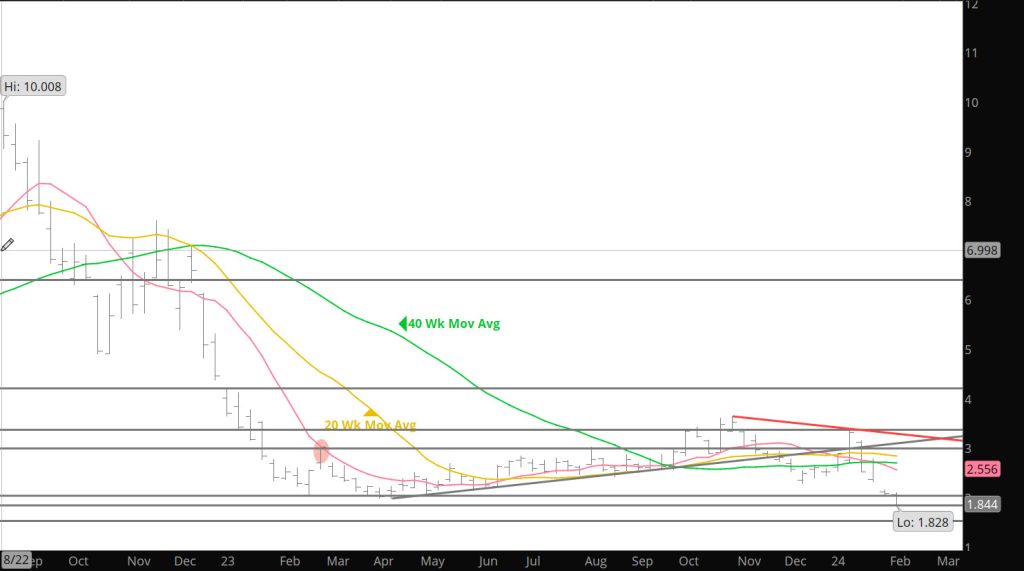
Weekly Continuous
March collapsed through and closed below support presented by the February – March – April ’23 lows. Friday’s close was the lowest since July ’20. March reversed from $2.127 and five straight lower closes I thought that prices would hold the support zones and form the construction of a trading range that would support a historically consistent Q2 rally. From that support there would be a annual Q2 rally which is still expected but the late winter/spring rally, will certainly commence from a lower price than expected, and likely be less than average (the ten years average is about 50%). You should also expect that the rally will be primarily be powered by short covering.
As mentioned last week, it does not get a lot more technically bearish than an “outside” month with a close below the previous month’s low with increasing volume. Before getting into a discussion of historical support, it is interesting that it took 41 weeks for prompt gas to trade from ‘23’s weekly closing low ($2.035) to the end of October weekly closing high (a gain of $1.438). It then took five weeks to fall from $3.473 to$2.469.
Stepping back a little from that more or less recent volatility, since the high trade on 10/30 ($3.630) prompt gas has fallen $1.813 or almost exactly 50% in fourteen weeks (normal cycle length). Over the last twenty years the average decline from Q4 highs to a Q1 (late winter/early spring low) is 41%, the ten years average is 44%, five years 48%.
Four years in June ’20 there was a suggestion to extend commitments as long as someone could be found to take the other side. That turned out ok. The key to technical analysis is to remain consistent…and to learn from history. Since the thoughts that the ’23 lows may and last week’s decline eliminated those thoughts, I am not willing to accept that we are yet approaching an analogous point. The trigger in June of ’20 was a reversal from a lower low which created multiple momentum divergences from a severely oversold condition (that’s the most common way for the market to communicate that it has traded to an unsustainable low). March gas is short – term oversold and the speculative short position is close to out of hand…total open interest is about the same as it was at the same time in ’20, before the bottom in June that total fell about 300,000, so don’t be surprised if there is short covering rally…which fails at a lower high, but the market is not that close to long – term oversold. For now, the target for prompt gas seems to indicate $1.50- $1.60.
Major Support:, $1.795-$1.766
Minor Support :
Major Resistance $2.00, $3.00, $3.16, $3.48, $3.536, 3.59, $3.65