Momentarily, I thought my analysis last week in the Weekly was spot on as the differential between Feb and Mar narrowed down under $.30 for a very brief period of time. After the previous week’s weak close, the market strongly suggested February would be offered lower (hence the confidence in closing the differential). It was almost a given that any rally by the suddenly oversold prompt would be sold at a lower high. Surprisingly, February recovered as much as it did, but not surprised when it reversed lower from $2.884 (the continuation 20 – week SMA was $2.877). The violated daily trend line and important moving averages provided daily closing resistance but little else can be drawn from the wide ranging days other than the to date calendar January trade low is higher than the December low.
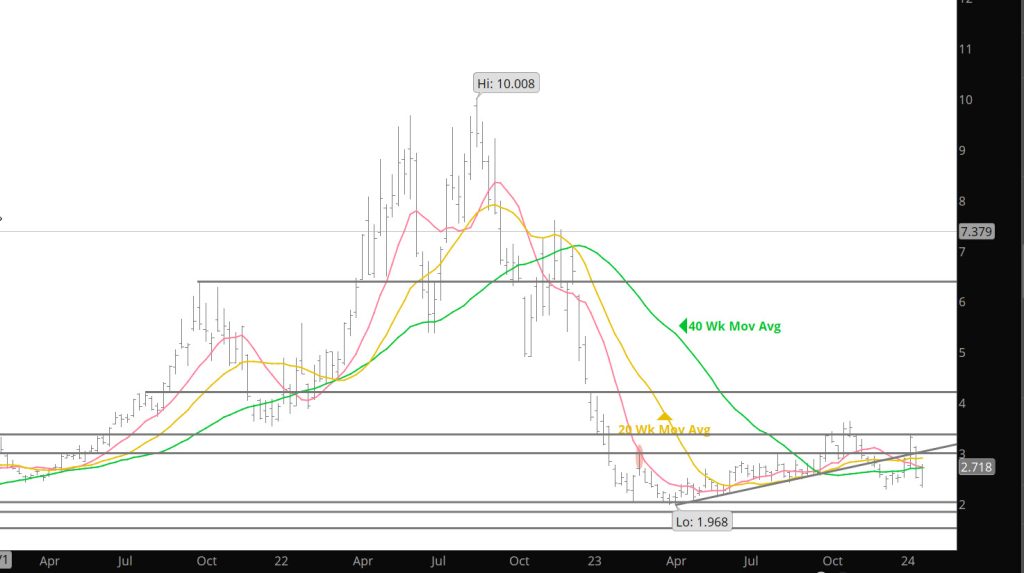
It is difficult to put a bullish spin on the price action last week but the March chart develops a few factors that serve to mitigate an overly bearish outlook. Perhaps the most significant of those is that March is sitting atop support that is more distinctly defined than at any time since the spring of 2020,(see March chart below) and before that during the late winter/early spring of 2016. Won’t spend a lot of time on those historical levels of support and how they were tested and held, currently, but long time readers will hopefully recall long past discussions of the consistency of prompt gas to trade in four year cycles. While not always exact…some a little longer, some not quite as long, that cycle can easily be observed since the beginning of natural gas trading in the spring of 1990…most recently 2012, 2016, 2020…2024??