Range / Consolidation Continues

Weekly Continuation

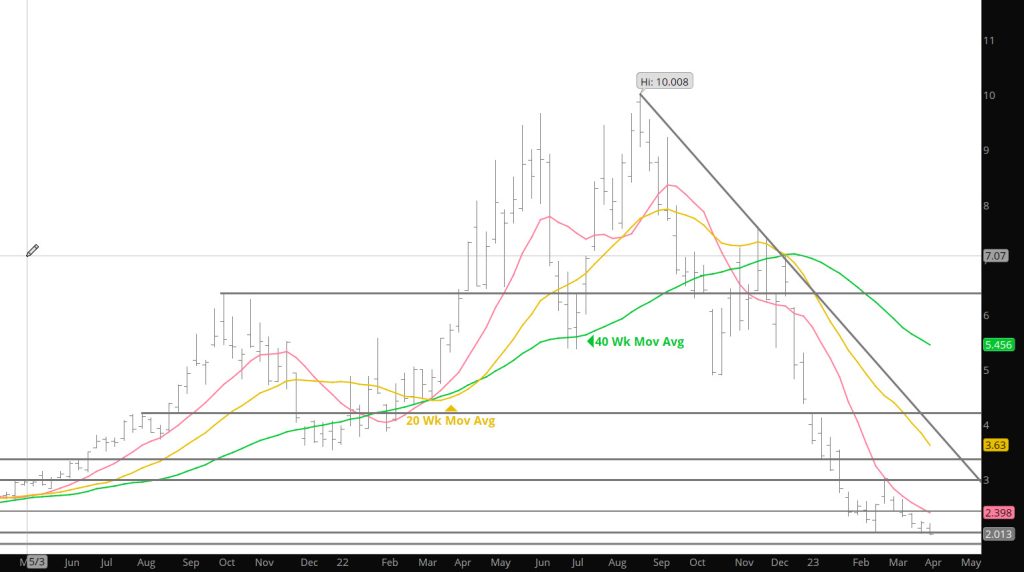
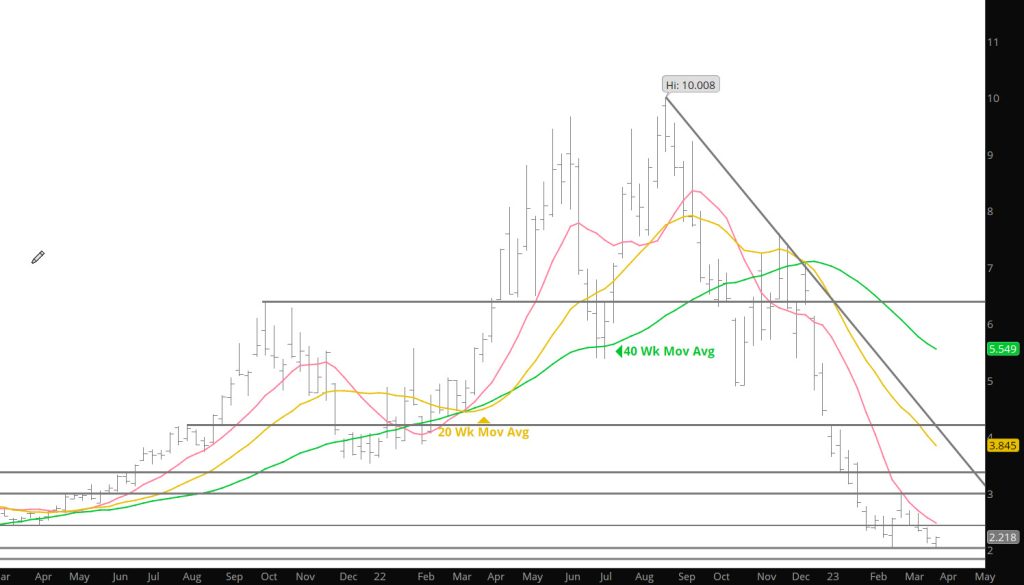
Not a significant change in perspective from last week when I wrote the following… When trade remains within the range traded during a previous period (whether days, weeks, or months) important support and resistance has been defined (as it has over the last few weeks, the longer the period the more important those levels are.  As mentioned previously, violation of either of the new extremes is usually a trigger for influential traders (speculative hedge funds) who have been and remain significantly net short the gas market. Trade through the April high (this week’s first close over the continuation 10 – week SMA as well as the 50 – day) since the week ending 12/16/22, suggests is the far more likely of the near term directional outcomes.

Last week the trade expanded the June lows into the continuation lows of previous periods before finding support. Don’t have a lot to add from a technical side other than it remains in the range environment and should be traded accordingly.

To read The Daily Call you must be a subscriber (Current members sign in here. ) Start your subscription today.

Rally Adjusts Perspective (for now)

Weekly Continuation

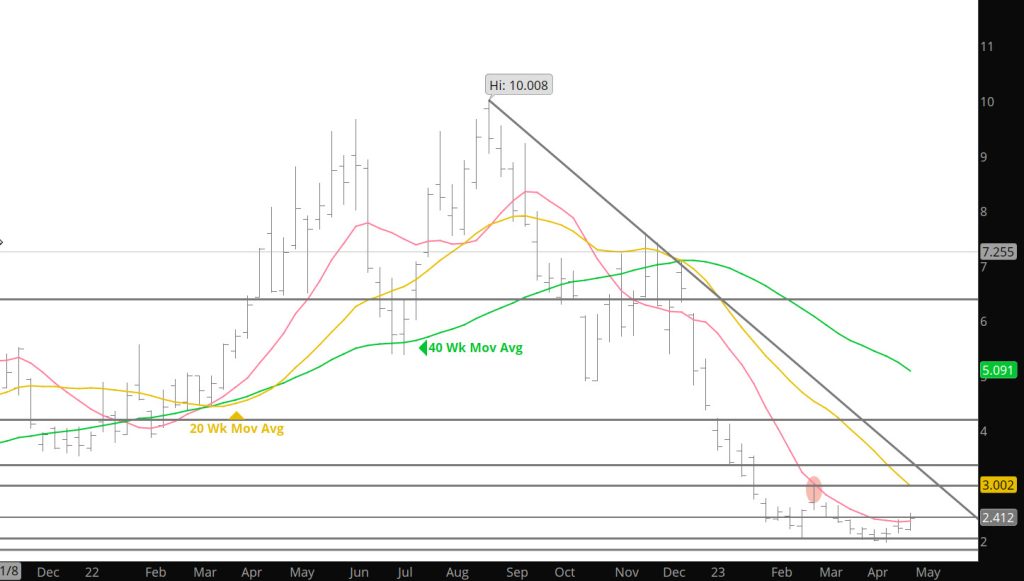
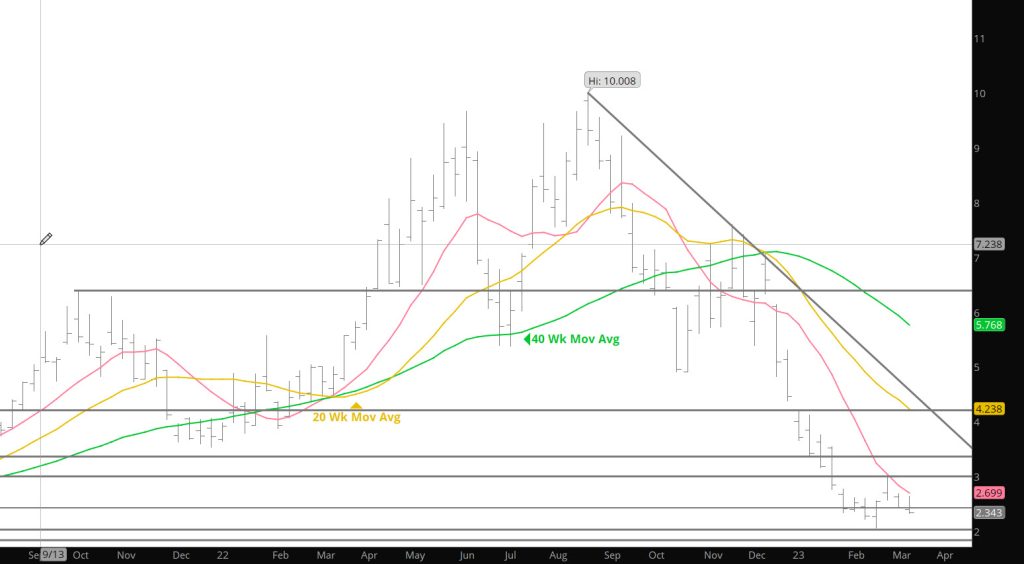
June fell back to test April’s final day high $2.274) before rallying through the resistance that had limited prompt gas last week and before May’s decline in expiration.  June’s recovery left it with the highest close since March 10th and notably over the continuation 10 – week SMA, for the first time since the week of the December high.  The continuation chart shows a constructive “outside” week with a close above last week’s high.  Despite the relative show of strength after May was off the board June failed just short of the high that it traded a week ago ($2.529 vs$2.543) and for a second week at resistance bracketing its February low ($2.468).  June ended the week just about where it began ($2.410 vs $2.395) but did manage a third straight higher close…the first back to back to back higher weekly closes since the first three Fridays of last July.  The zone of resistance between $2.468 – $2.543 and June’s 10 – week (currently $2.604 and declining) is likely to be a formidable barrier to extending the rally particularly given that volume fell again this week.

When trade remains within the range traded during a previous period (whether days, weeks, or months) important support and resistance has been defined (as it has over the last few weeks, the longer the period the more important those levels are.  As mentioned previously, violation of either of the new extremes is usually a trigger for influential traders (speculative hedge funds) who have been and remain significantly net short the gas market. Trade through the April high (this week’s first close over the continuation 10 – week SMA as well as the 50 – day) since the week ending 12/16/22, suggests is the far more likely of the near term directional outcomes. This will likely extend the rally toward the March recovery high ($2.674, 03/14).

To read The Daily Call you must be a subscriber (Current members sign in here. ) Start your subscription today.

Strength Continues

Weekly Continuation

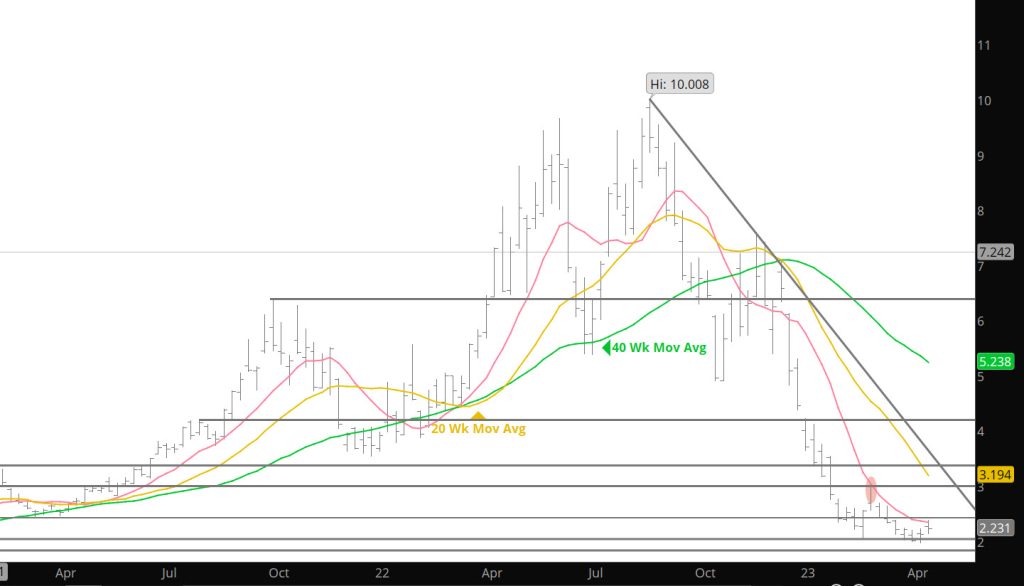
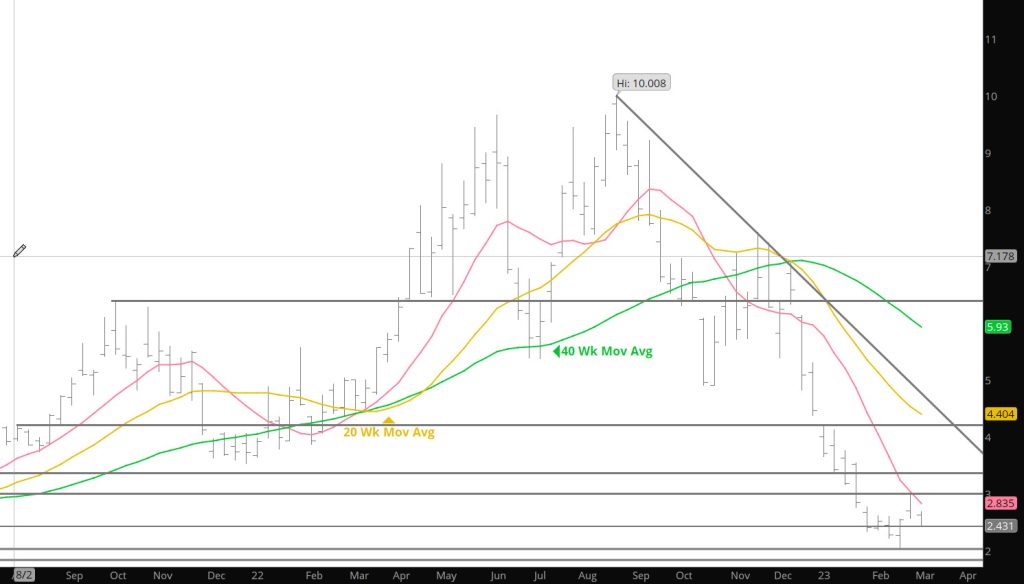
Following the week ending “outside” day reversal with a close near the session’s high, two Friday’s ago, the now soon to expire prompt gapped through the still declining moving average when trading resumed last week and formed a daily continuation gap that remains open between $2.132 and$2.140 ( it has been a while that a support gap has not been filled immediately). That gap higher opening kicked off an extension of the rally, the first three day rally since the recovery from the February low. At the high point of the two weeks late February/early March rally (which also occurred on a Friday) then prompt April failed at the declining 10 – week SMA and that is exactly what the two weeks rally from the April low did ( so far). This value of the widely watched 50 – day simple moving average (the 50 – day SMA is about the same as the 10 – week, but because of holidays, not quite) on Tuesday was $2.368, the week’s high was $2.385 (which was also the low of 03/15 ). The converging conventional and moving average resistance was way too much for the prompt gas to get through on the first try, particularly given that volume was falling (Monday 545,000 (which was less than during Friday’s reversal day volume of 563,000. ), On Tuesday , the day of the high, the volume clocked 377,800, but the 20 – day SMA showed up as support. Recovery from the now flattening moving average support left the prompt higher in four of five trading days, the gap still open and with the highest weekly close of five.

The recent two week rally does not signify the end of the bear market, but it is becoming easier to see the construction of a short – term base since the middle of March on the continuation chart. Substantial downside momentum that had built during the precipitous decline from the December high seemed to be exhausted when prompt gas rallied 50+% from the February low closing not far off the month’s high, Typically, that is about as positive as price action gets after trading a very significant low with a momentum divergence.

To read The Daily Call you must be a subscriber (Current members sign in here. ) Start your subscription today.

Sellers Running Thin?

Weekly Continuous

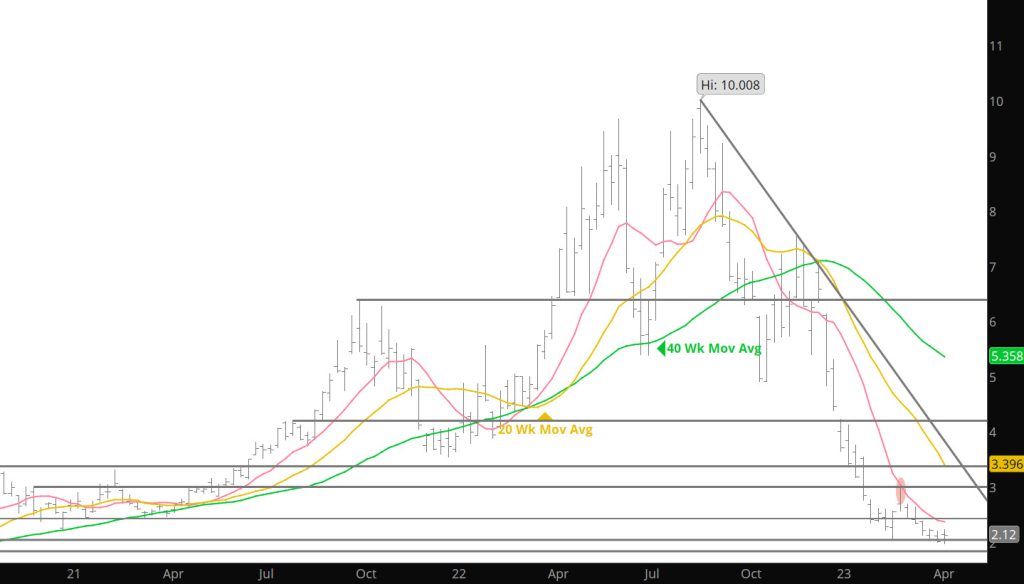
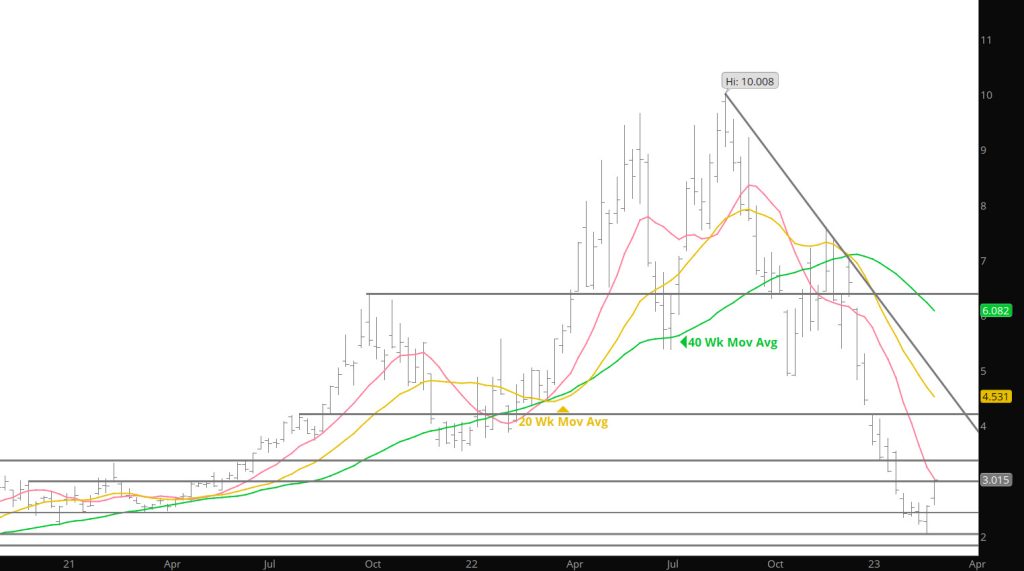
Despite an bearish outside week reversal to the downside, selling sufficient to drive the prompt through the lower extreme of the narrow zone did not materialize. The the failure to extend the decline (the low was $1.946) toward the September ’20 low ($1.795) triggered a short covering rally that left May $.103 higher for the week.  That recovery from a test of such obvious and critical, support is a pretty good indication that at least for the near term May may start to look like it is running out of sellers. Technical improvement was also evidenced by the highest volume week since last since last September. Mentioning in previous analysis that weekly volume has been on balance declining since just prior to the February low and suggesting that selling pressure has been starting to dissipate. In addition, total open interest declined 38,702 contracts–the largest one week decline in the total of contracts outstanding since the beginning of the collapse from the August high.

Last week does not “announce” a trend change but rather a potential of a shift. This market’s declines are not “over” and buying dips (on a limited scale) may turn out profitable over time. If prompt gas is able to remain “inside” the March extremes during calendar April and end the calendar month higher than it began ($2.085-which stands to be possible given a boost by June’s current premium over May ($2.305 v$2.114), aggressive sellers may start to re-evaluate their beliefs.

Major Support: $2.00, $1.991-$1.96, $1.795-$1.766
Minor Support:
Major Resistance $2.12-$2.184, $2.36, $2.836, $3.00, $3.536, 3.595

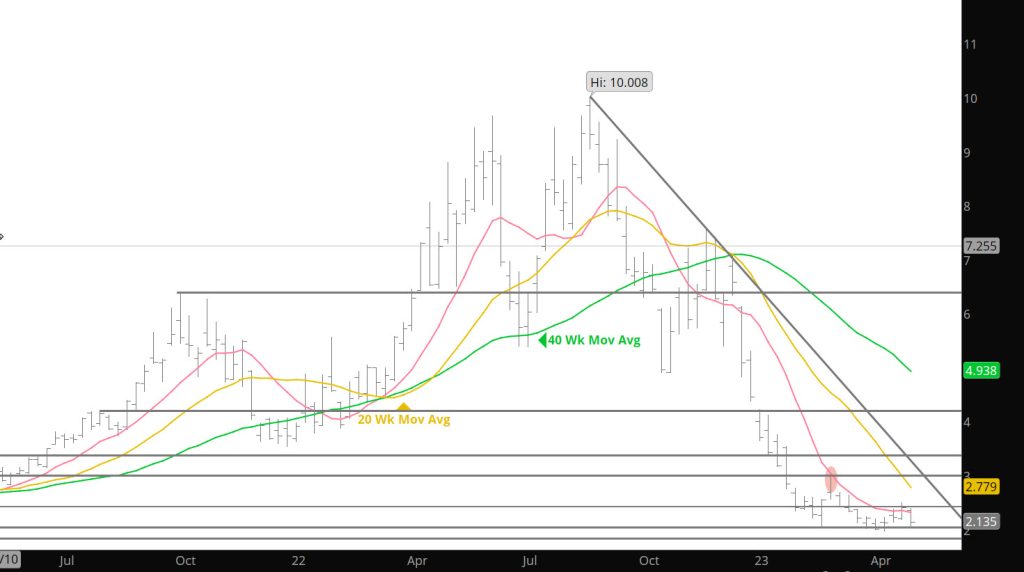
Price Action Getting Ugly

Weekly Continuous

On Good Friday (I forgot no trading) I wrote the following….Prices dropped below $2.00 and suggested closing below that important area but found some minimal support. A close below that level sill suggest additional declines will be coming. Today will provide some important indications for the May contract and bias objectives going into the historically strong summer (power demand) season. Well — there was no trading on Friday and the market remains at the Thursday close.

There are no technical indications of a positive bias entering or even attempting to enter this market (that in itself leaves me with a positive bias). While total volume has on balanced declined since mid – February, particularly since the March high, average daily volume increased significantly during a period that it typically does not (volume is historically subdued during a shortened week, this past week Thursday was the highest volume day since the 03/21 upside reversal day). Increasing volume as price falls is technically negative.

To read The Daily Call you must be a subscriber (Current members sign in here. ) Start your subscription today.

Price Declines on Expiration — Expect More

Weekly Continuous

In my absence, prices decided to test the support at the Feb lows and break below it briefly. There have been some ugly monthly ranges traded since prompt gas turned down last August, the chart for calendar March is as ugly as any. After a technically positive calendar February prompt April promptly traded through the previous month’s high on March’s first trading day then before its tenure was over plunged through its low creating the first “outside” March since 1998 and the first ever to reverse to the downside (in ’98 the prompt first traded through the Feb low before rallying through and closing above the Feb high). The continuation monthly bar could have only been uglier if the close had been below the Feb low which owing to May’s premium over expired April and Friday’s only higher daily close of this week,, it wasn’t. The monthly chart of May gas did achieve that benchmark and is even uglier as it closed lower for the week, month, and quarter below its February low.

As patently bearish as the market seems, and expecting the consensus of technical indicators had weakened further from the prior week’s negative to neutral bias “ to outright negative, close examination indicated that was not the case. Almost none of those indicators confirmed the lower price low which either means they are out of step with reality and need time to catch up although recent price ranges have been relatively modest so that should not be the case, or the subsurface dynamics are diverging from the persistent price weakness. For example, last week average daily volume accelerated as April fell toward a new low weekly close and as has become the custom closed below the previous week’s low. Market internals…volume and open interest, which also continued to increase as price fell, strengthened the technical presumption that April would be offered lower before going off the board.

To read The Daily Call you must be a subscriber (Current members sign in here. ) Start your subscription today.

Lower Weekly Close Suggests Continued Weakness

Weekly Continuous

A lower weekly close and closing the week near the lows– clearly suggests that the market should head lower this week. Still trying to establish whether this market is going to tests the lows of last month, or does it find the buying to set a higher low and continue the thesis that a base is building for the Q2 run. While the continuation one – year strip did not record a lower daily or weekly close ($3.088 vs $3.060) the same could not be said for the summer ’23 and winter ’23 – ’24 both of which closed at a new weekly low. That weakness in deferred contracts (which had held up somewhat better than the nearby contracts) suggests a reduction of intermediate/long – term participant expectations and likely an increase in already substantial speculative short positioning. This actions suggests that speculative shorts are exposed to another and perhaps more significant event than occurred during the eight day period ending 03/03 (when prompt gas closed higher for seven of eight days while rallying from $1.967 to $3.027). Notwithstanding that potential expectation, the acceleration of weakness in the strips with the new low closes, indicate that at least for the near – term the entire maturity curve is likely to be vulnerable to the downside. New low weekly closes for prompt gas and the continuation strip will confirm the indication from the deferred that, at a minimum, the gas market intends to test the February low.

In recent weeks volume has on balance declined during rallies, increased when price fell. This past week average daily volume fell along with price and was only higher one day than the corresponding day the previous week. New contracts continued to be added to total open interest which has increased in all but two weeks since mid – December (both small declines). This week with prompt gas only $.029 lower from Thursday to Thursday (open interest lag one day) a modest 1,345 contracts were added. This is the smallest addition of any of those weeks. Both volume and open interest entered the past week with a price negative bias but earned an upgrade to neutral.

To read The Daily Call you must be a subscriber (Current members sign in here. ) Start your subscription today.

Declines Test Strong Support Zones

Weekly Continuous

Prices tested and gave up gains as prices tested the moving Avg on the week before. As long as these moving averages are declining, they will provide inviting, low risk sell opportunities, just as they provided similar opportunities during the uptrend last year. Given the dramatic reaction to last week’s first approach I’d guess it will take an extended period of consolidation allowing time for the slope of the declining resistance to lessen and for the construction of a base sufficient to support more than a one or two week rally (higher closes for the last two weeks were the first consecutive higher weekly closes since the first two Fridays of December) toward a traditional spring/summer high…and there is still that requirement that prompt gas find support at a higher low.

Market internals faded to neutral last week after showing at least tepid support for a price recovery in mid/late February. This week average daily volume increased as prompt gas fell and open interest resumed adding contracts after a one week decline (the 13th increase in 14 weeks). A price negative bias was added to both. Volume declined minimally from the previous week.

To read The Daily Call you must be a subscriber (Current members sign in here. ) Start your subscription today.

Bullish Move But Caution

Weekly Continuation

Prompt gas finished higher for a second week and the third time in the last four. Consecutive higher weekly closes have not occurred since the rally from the October low and prompt gas had not been higher in three of four weeks since the portion of the rally to the August high. Those rallies failed but failure currently will just test support zones not the declines we saw in the fall (sorry — don’t see prices to zero).

Weekly charts give useful information for purposes of hedging and term positioning vs Daily charts which are quick snapshots of what short term actions are coming. For an intermediate/long – term perspective the monthly charts are invaluable for filtering out distracting trading “noise”. For example, the June ’21 breakout through the Q4 ’20 high was an ominous warning of an extended period of higher prices. Last summer there was a warning of a different type, this one in the form of an extremely rare monthly event which was back to back “outside” months during calendar June and July (it is unusual if that occurs on a weekly basis at the least). That event was noted at the time along with a discussion about weekly volatility. Rare monthly events always send a message. The market may have sent another one by the price change during February.

To read The Daily Call you must be a subscriber (Current members sign in here. ) Start your subscription today.

Market Bias Maybe Changing

Weekly Continuous

After trading to $1.967 March rallied into expiration to settle at $2.451 (+$.484). Even with positive closes for its last two trading days, it was the lowest contract expiration since October ’20 settled at $2.101. It doesn’t seem like much, but prompt March rallied to close higher in two of the last three weeks, perhaps a redefining event– more importantly, the deferred contracts rallied a fair amount more than they did two weeks ago. For example, when March ended week ending 02/10 $.121 higher the summer strip was $.099 higher, winter ’23 – ’24 $.020 higher. This week with prompt gas closing $.176 better the summer was $.203 higher, winter $.128. Given the magnitude of the declines in those strips over the last few months, that may not seem like a big deal, but perhaps the gas market is beginning to change.

Following that first print under $2 since prompt gas spent about a week there while constructing the September ’20 low, March reversed higher accompanied by increasing volume (due to the Holiday shortened week I will us the average daily volume did increase modestly) Tuesday – Thursday was greater than the corresponding days the prior week when March was falling. Weekly reversals more likely when they begin from an undercut of a previous weekly low and an extremely oversold condition, have long been the gas market’s preferred method of communicating that the price pendulum had swung too far one way or the other. Often those reversals create momentum divergences because mathematical indicator. In this case the the weekly RSI, didn’t have time to catch up to confirm the lower price low (these divergences have been discussed previously).

To read The Daily Call you must be a subscriber (Current members sign in here. ) Start your subscription today.