
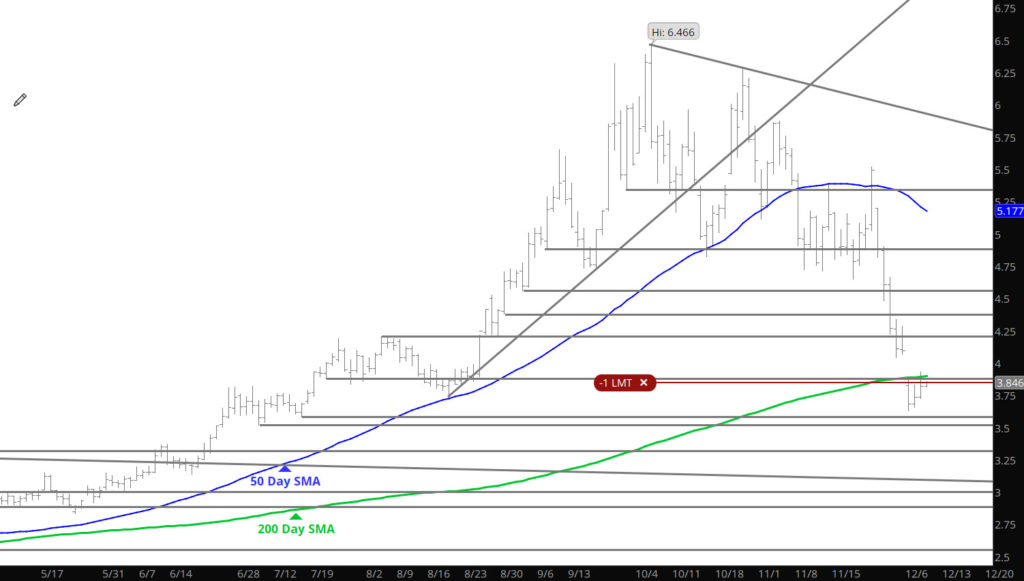
The Gap

Daily Continuous

Prices started to close the gap from the open on Monday, climbing into the low end of the gap at $3.931. This closes the first $.05 of the total gap. Would not recommend buying into or selling into this move– rather take a day and a storage report to confirm the trend, whether that trend is a continuous decline or the start of a rally that may take prices through the gap and higher.

Major Support: $3.734, $3.584-$3.522
Minor Support:
Major Resistance: $3.91,
$4.02, $4.127, $4.25 $4.61, $4.67, $4.735, $4.825, $5.1

To read The Daily Call you must be a subscriber (Current members sign in here. )

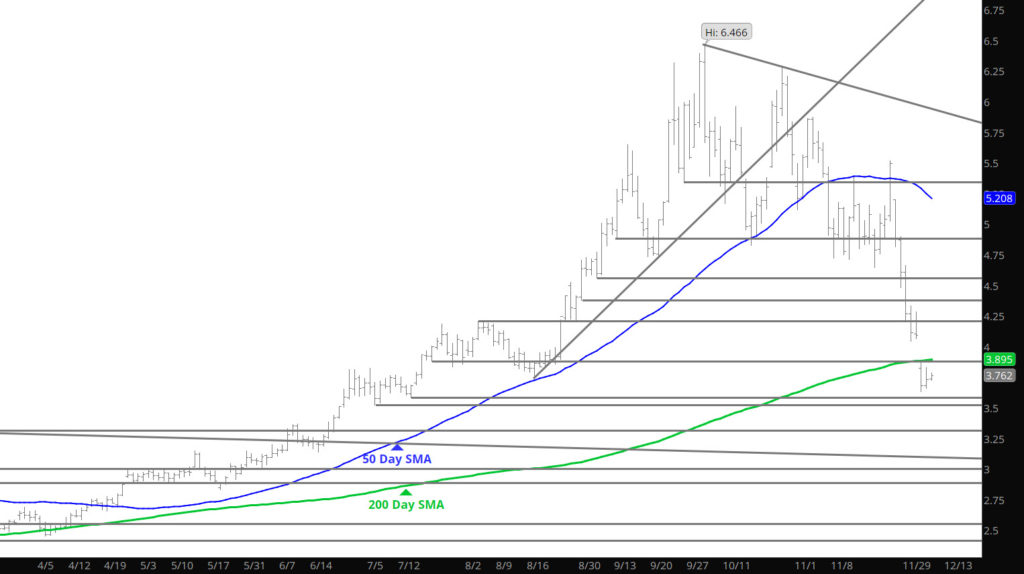
After $1.90 Decline in Seven Days – A Rest
Daily Continuous

If you are a bear and thought you were going to get another $.40 decline after the last $1.90+ then grow up or stop trading. Now the market should hit a consolidation trade for a period of time. The fundamental folks all say the declines are because of forecasts. Guess its going to be 70 in Chicago all winter— you know we should address this man made global warming — it having an impact on trading. Whoa, this kinda of sarcasm got me in trouble with a few of you last fall– and that too was about forecasts. So let me digress to what I understand — prices will not go to zero and trees don’t grow to the sky. Time to chill for a while– did I mention that gap??

Major Support: $3.734, $3.584-$3.522
Minor Support:
Major Resistance: $3.91,
$4.02, $4.127, $4.25 $4.61, $4.67, $4.735, $4.825, $5.109-$5.175, $5.339

To read The Daily Call you must be a subscriber (Current members sign in here. )

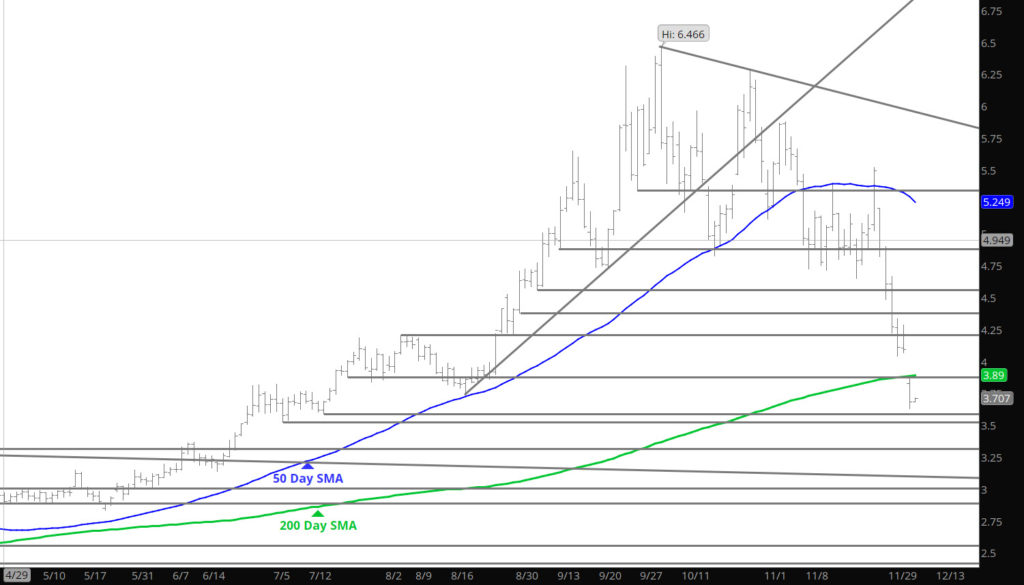
Gap Open Below Significant Support
Daily Continuous

That is how natural gas likes to eliminate support zones — wait for the weekend and open below the support zone and force a daily and weekly gap in the charts. So it goes when trading gas — we now know the upper boundary for resistance near term and that would be the gap. The support goes back to last summer/spring as prices consolidated for a week around $3.584-$3.522. The market has entered over sold category but we saw that it can stay in the extreme zone last fall as prices were over-bought.

To read The Daily Call you must be a subscriber (Current members sign in here. )

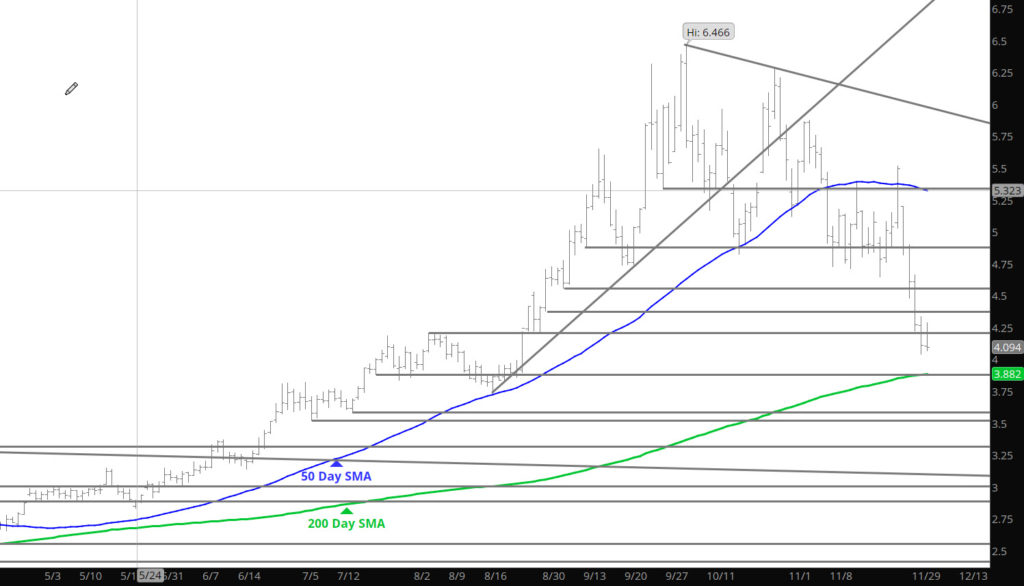
Declines Late Friday Suggest Test April Lows
Daily Continuous

While prices rallied during Friday the selling at the end of the day suggests that prices will open lower which they did in a big way on Sunday night. Opening a gap through the major support zone that prompted the rally last spring. Now we need to see the response to the gap opening and how low prices are tempted to go. Needless to say, the market is becoming over sold and folks seem real comfortable with the “winter is over” concept — seen this before take a look at Dec ’15.

Major Support: $3.944, $3.91, $3.87, $3.734
Minor Support:
Major Resistance:
$4.02, $4.127, $4.25 $4.61, $4.67, $4.735, $4.825, $5.109-$5.175, $5.339-$5.40, $5.64

To read The Daily Call you must be a subscriber (Current members sign in here. )

Next Stop?
Daily Continuation

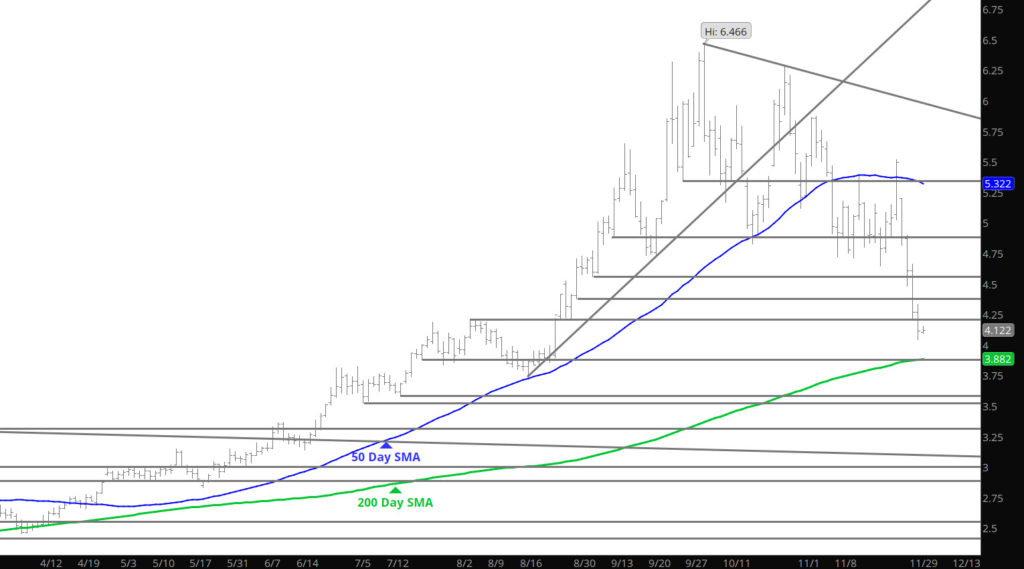
Decided to add the Weekly continuation (below) chart to give an idea of what the declines are looking for. I would expect that a continuation of weakness below $4.00 will find some liquidation covering (stops) that send prices down an additional $.03-$.05– but the real target is likely the 40 week SMA (close to the 200 day SMA) at $3.90 which has held the market since Sept ’20. A break below that will have serious technical implications. In the near term the market is now starting to approach the extreme zones on the momentum indicators (Daily RSI) but could test the $4.00 before entering the extreme zone. The market seems to be looking for the low end of the new range and perhaps today will give us a better indication.

To read The Daily Call you must be a subscriber (Current members sign in here. )

Gains From Last August — Gone
Daily Continuous

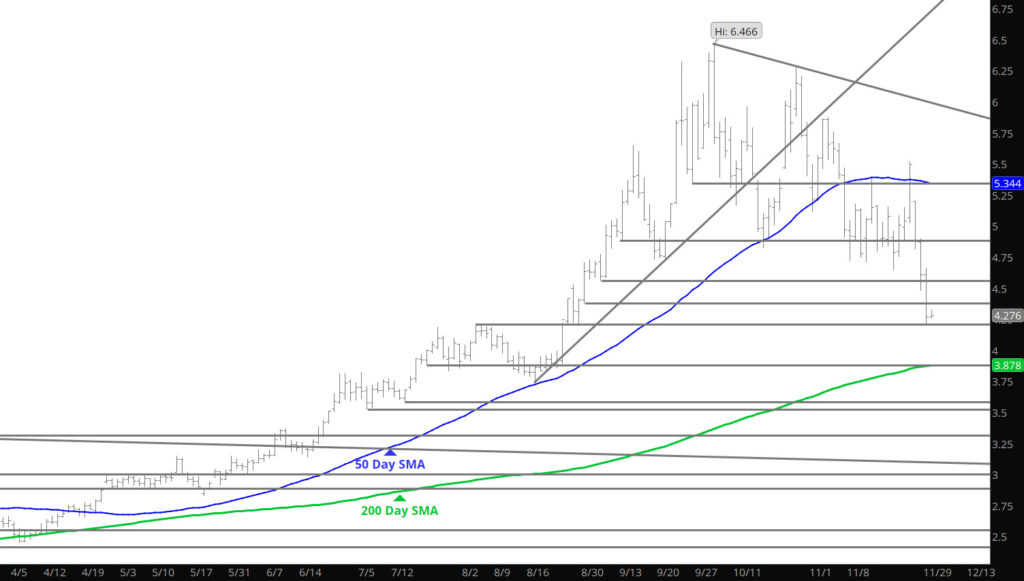
Looking at the Chart above you will notice that all of the run since the first week in August has now been eliminated — that does not mean that any potential rally can’t happen– but yesterday’s follow through, likely means that rallies will provide good places to sell to traders. Yesterday, mentioned that the bias had been modified to neutral and with the extension below additional support zones, the trade bias is now distinctly bearish.

Major Support: $4.561, $4.375, $4.276, $3.944
Minor Support:
Major Resistance: $4.61, $4.67, $4.735, $4.825, $5.109-$5.175, $5.339-$5.40, $5.64, $5.964, $5.996

To read The Daily Call you must be a subscriber (Current members sign in here. )

Declines Break Long Held Support
Daily Continuation

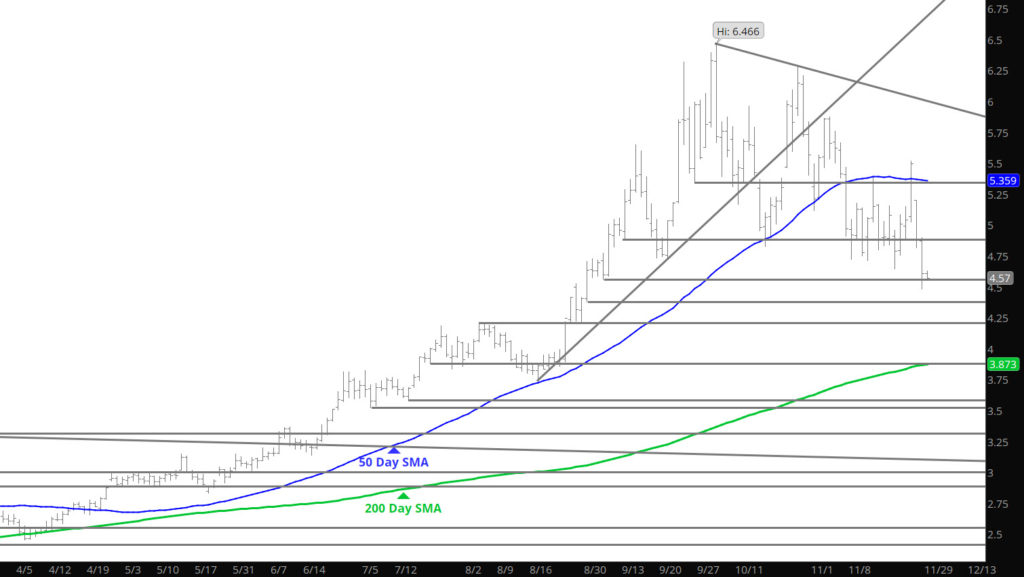
The extension breaking below the support levels that had held the market during the fall ($4.70) broke down yesterday and as expected, the extension has modified the bias to neutral from the previous bullish standing. The long term bullish trend remains but the current trade should be considered neutral to slightly bearish bias currently. Fundamental traders have to be scratching their heads as all during the run in the fall the trade constantly utilized the bullish Dutch and Britain gas contracts as support for the run in Nymex. Small problem with that logic as both those contracts have remained firm while the Nymex has dropped nearly a dollar. Guess this is another reason why I rely on technical data points and not the games (or narratives) that press and pundits play. Take a breather and let the market settle for a day or two.

Major Support: $4.67, $4.61, $4.561, $4.537,$4.458,$4.375, $3.944
Minor Support:
Major Resistance: $4.735, $4.825, $5.109-$5.175, $5.339-$5.40, $5.64, $5.964, $5.996,$6.177, $6.24

To read The Daily Call you must be a subscriber (Current members sign in here. )

Collapse Should Test Intermediate Major Support
Daily Continuous

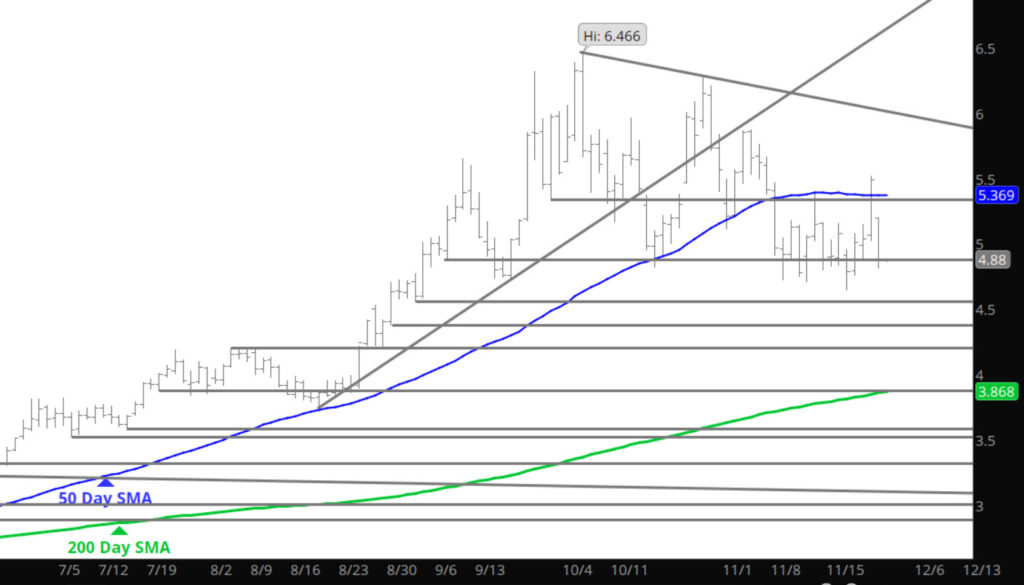
Prices extended down another $.25 from the Sunday night initial movement and looked like they were poised to test the major intermediate support around $4.70 before some folks brought some buying back to the market. I said last month (couple of times) that if prices don’t break below the intermediate support levels — then they were gonna miss a great opportunity. Same thoughts are now and it will be interesting to watch. All the fundamental folks say winter in December is over so if support holds — then the market is saying something. Should it break- then the bullish bias for three months is brought into doubt.

Major Support: $4.825, $4.728-$4.70, $4.61, $4.537,$4.375,
Minor Support: $4.66
Major Resistance: $5.109-$5.175, $5.339-$5.40, $5.64, $5.964, $5.996,$6.177, $6.24-$6.493

To read The Daily Call you must be a subscriber (Current members sign in here. )

Sunday Opens with Collapse
Daily Continuous

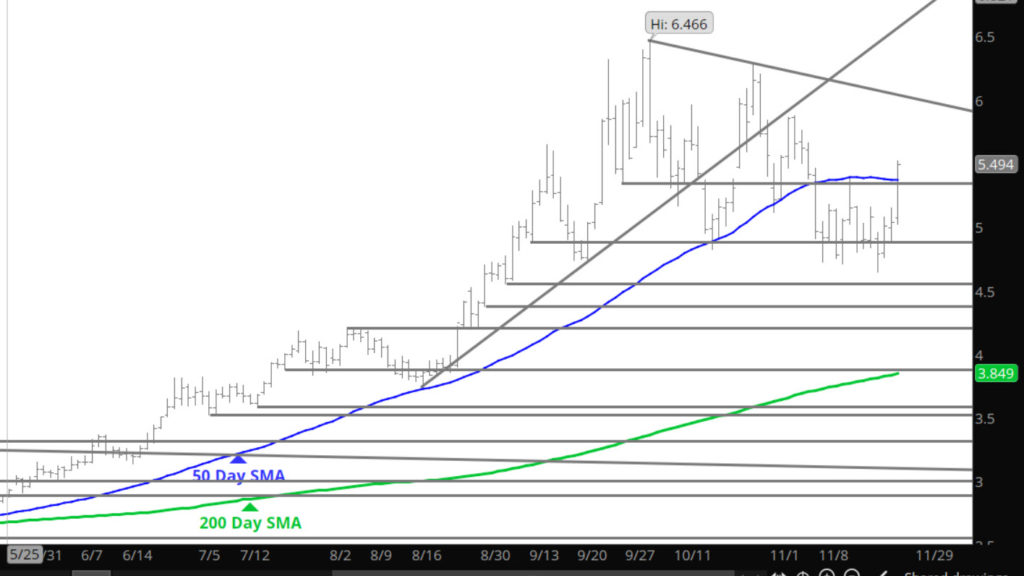
Expanded on the expiration in the Weekly section and expectations for the coming period, many of which are becoming accurate in the early trade on Sunday night. Similar to the major declines last month– the move should test the low end of the range (established and confirmed last month) around the $4.70 area. This is the key area discussed a couple of weeks ago highlighting the trend of higher highs and higher lows since fall ’20 that has helped define the recent bullish bias to trend.

Major Support: $4.825, $4.728-$4.70, $4.61, $4.537,$4.375,
Minor Support: $4.66
Major Resistance: $5.148-$5.175, $5.339-$5.40, $5.64, $5.964, $5.996,$6.177, $6.24-$6.493

To read The Daily Call you must be a subscriber (Current members sign in here. )

The Rebound Off of Support
Daily Continuation

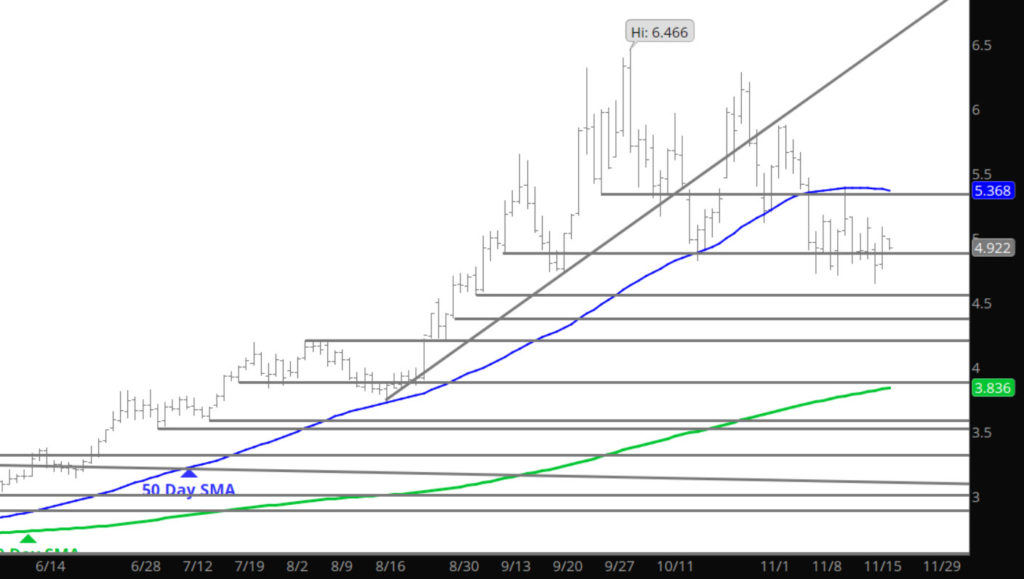
Let me take this opportunity to wish all a Happy Thanksgiving Holiday as prices continue to maintain the range with some slight extension early in the day or after hours with Globex platform. Would expect this range action to continue during the expiration but volatility may be exaggerated with light trade over the next couple of days.

Major Support: $4.825, $4.728-$4.70, $4.61, $4.537,$4.375,
Minor Support: $4.66
Major Resistance: $5.148-$5.175, $5.339-$5.40, $5.64, $5.964, $5.996,$6.177, $6.24-$6.493

To read The Daily Call you must be a subscriber (Current members sign in here. )