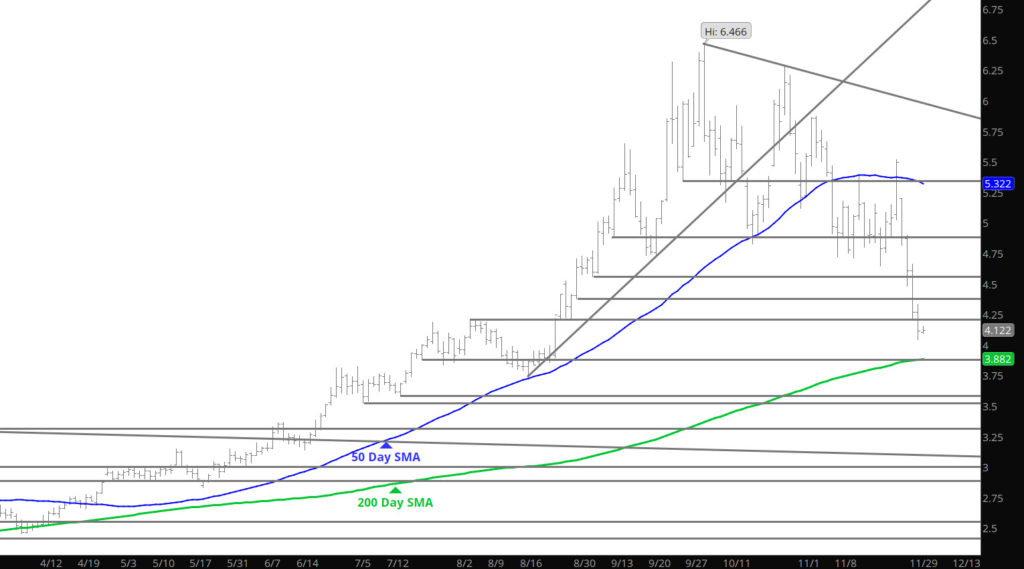
Decided to add the Weekly continuation (below) chart to give an idea of what the declines are looking for. I would expect that a continuation of weakness below $4.00 will find some liquidation covering (stops) that send prices down an additional $.03-$.05– but the real target is likely the 40 week SMA (close to the 200 day SMA) at $3.90 which has held the market since Sept ’20. A break below that will have serious technical implications. In the near term the market is now starting to approach the extreme zones on the momentum indicators (Daily RSI) but could test the $4.00 before entering the extreme zone. The market seems to be looking for the low end of the new range and perhaps today will give us a better indication.