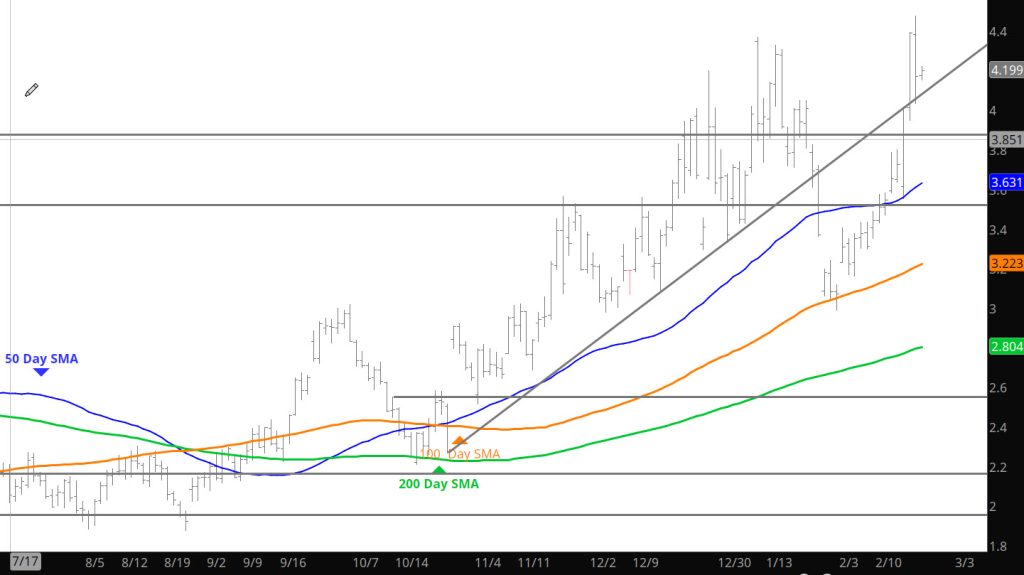
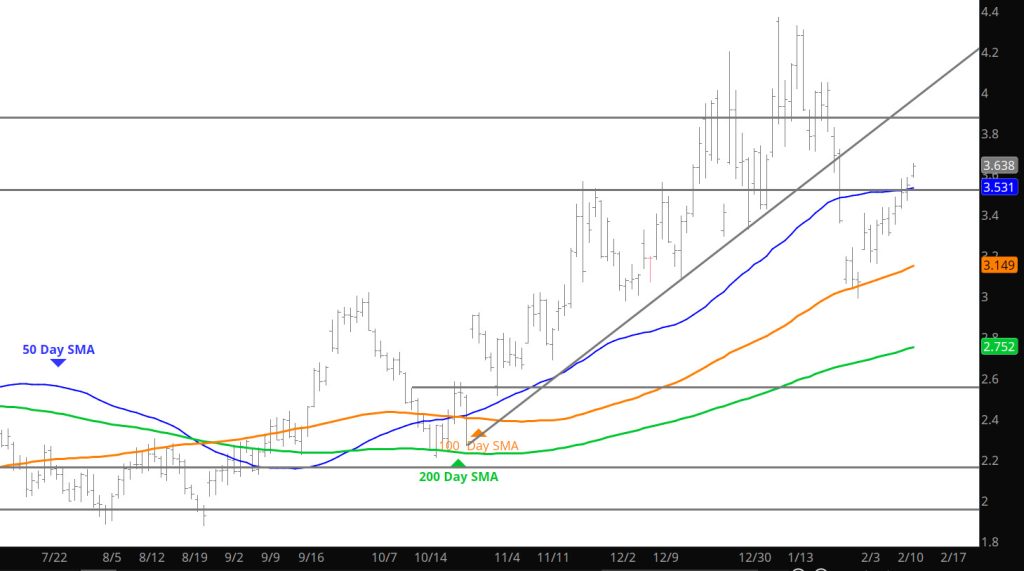
The run ran out of steam and retraced after the storage release which I thought was bullish miss. That is why I don’t follow trade on fundamental data. The declines did not break below $4 and now that seems to be support. There are four more trade days in the March contract, and the decline I was expecting (to major support at $3.16) seems unlikely. Should the market remains supported over the next days there may be a new “range” or para-dime in natural gas during 2025. This recent strength should be respected and I will follow up with additional analysis over the weekend.
Major Support:,$2.727-$2.784, $2.648, $2.39, $2.35, $2.112, Minor Support : $3.34, $3.167, $3.00-$2.95, $2.914, $1.856,$1.89-$1.856 Major Resistance: $4.00, $4.201, $4.378-$4.394, $4.461,
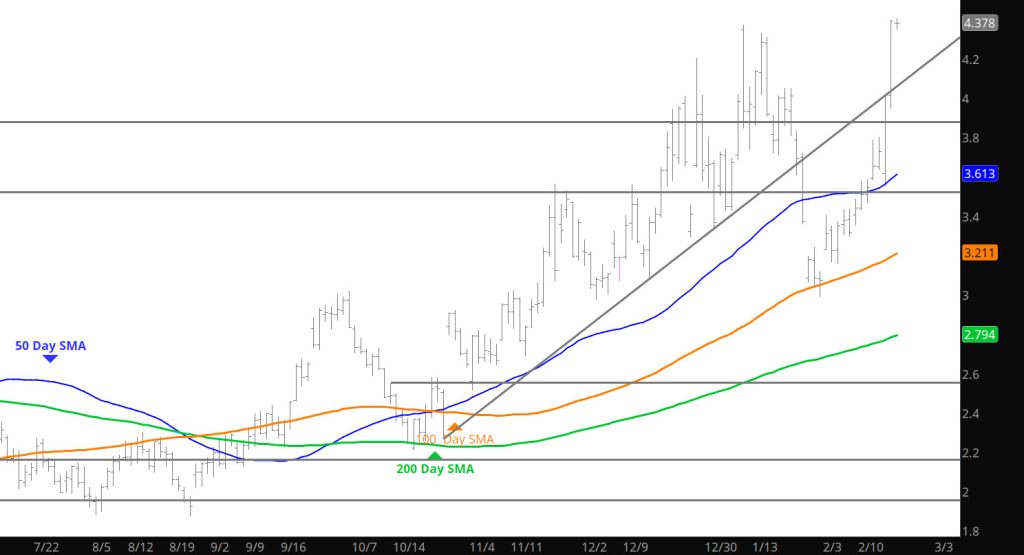
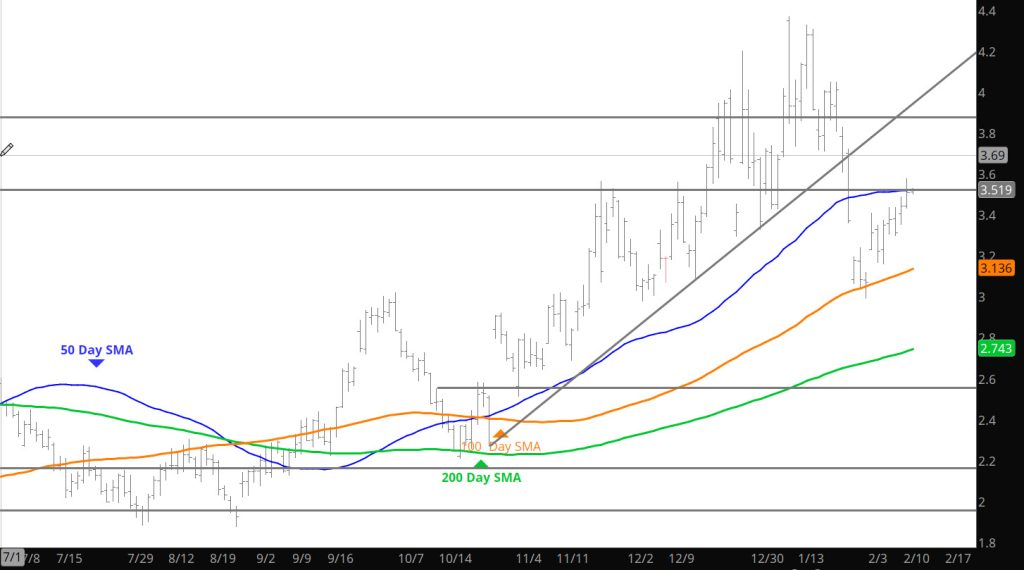
Discussed it in the Daily published after the failure of the server to send out the Daily yesterday– the market closed at the previous Jan High and that suggests higher highs is a bullish trend– will the bullish trend continue — we will get a further indication with the storage release today.
Major Support:,$2.727-$2.784, $2.648, $2.39, $2.35, $2.112, Minor Support : $3.34, $3.167, $3.00-$2.95, $2.914, $1.856,$1.89-$1.856 Major Resistance: $3.829, $3.92, $4.00, $4.201, $4.369, $4.378-$4.394, $4.461,
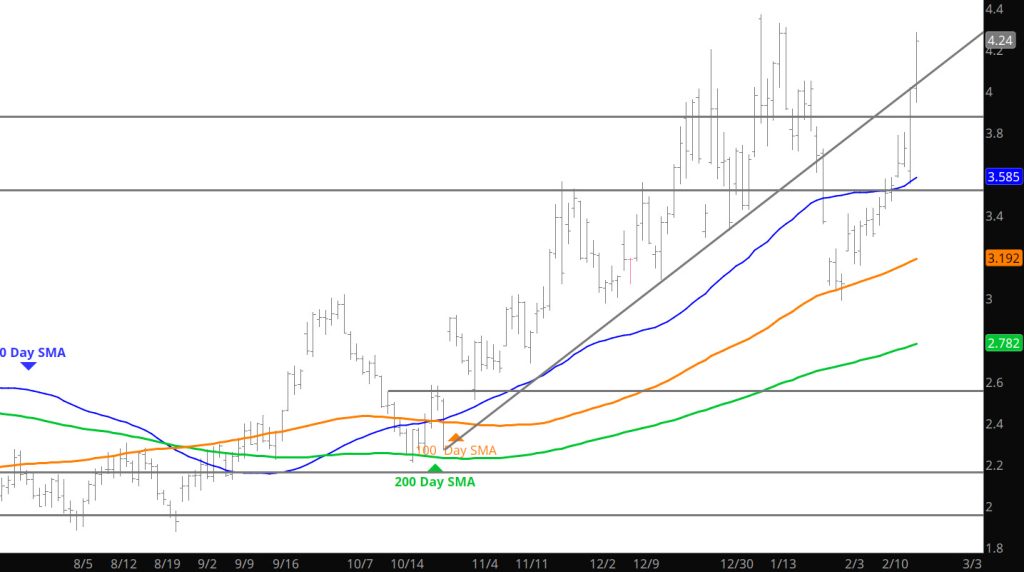
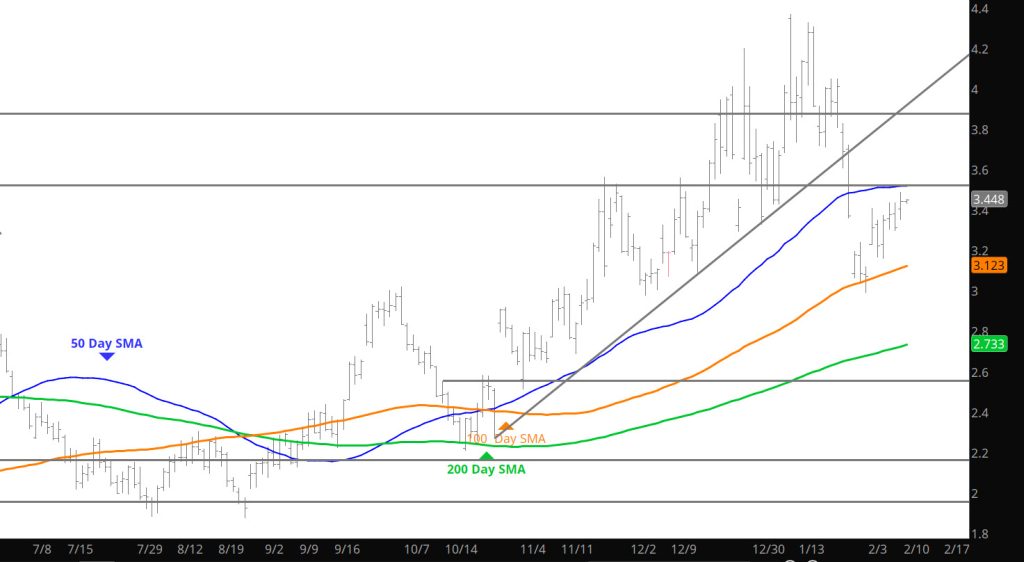
Apologies to all as the server had issues landing the Daily this morning — was going to discuss the close over $4.00 being a solid test of resistance at the January highs but the expectation was for the market was to retrace and set up a test of support around $3.20. Had no clue on this extension up to the January highs (but as of this writing) but seems to be running out of buyers. Will be interesting to observe this closing and the week’s closing as perhaps Nat Gas is joining many of the other commodities in their bullish trends and adventures (many of which are tied to dollar strength). A higher high will suggest such an interpretation.
Major Support:,$2.727-$2.784, $2.648, $2.39, $2.35, $2.112, Minor Support : $3.34, $3.167, $3.00-$2.95, $2.914, $1.856,$1.89-$1.856 Major Resistance: $3.829, $3.92, $4.00, $4.201, $4.369, $4.378-$4.394, $4.461,
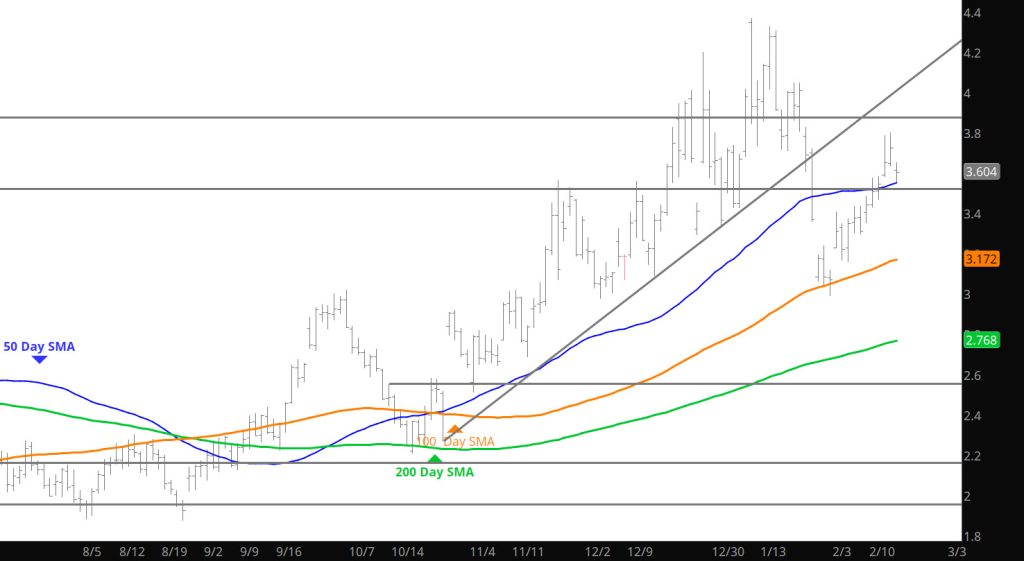
With the light trade on the holiday, prices retreated back down to conventional support from the 50day SMA. Went into expectations in the Weekly Section but from the Daily perspective — it’s the range controlling the trade.
Major Support:,$2.727-$2.784, $2.648, $2.39, $2.35, $2.112, Minor Support : $3.34, $3.167, $3.00-$2.95, $2.914, $1.856,$1.89-$1.856 Major Resistance: $3.829, $3.92, $4.00, $4.201, $4.378-$4.394, $4.461,
The move continued (especially in the late day trade) trying to entice the rally to take out the $3.84 area (not a higher high- monthly) but will lead to potential trade to set a higher monthly high– today is storage which may bring the volume to set a new high.
Major Support:,$2.727-$2.784, $2.648, $2.39, $2.35, $2.112, Minor Support : $3.34, $3.167, $3.00-$2.95, $2.914, $1.856,$1.89-$1.856 Major Resistance: $3.829, $3.92, $4.00, $4.201, $4.378-$4.394, $4.461,
This run in prices is starting to work against further gains as prices are setting lower highs and lower lows so far this month. We all understand that bull runs need to feed off of themselves to extent higher and so far in Feb it is not happening. Technical data points don’t seem to be directing this move and fundamental data points will start to become an issue as the current weather systems correct to more seasonal patterns.
Major Support:,$2.727-$2.784, $2.648, $2.39, $2.35, $2.112, Minor Support : $3.167, $3.00-$2.95, $2.914, $1.856,$1.89-$1.856 Major Resistance: $3.34, $3.39, $3.829, $3.92, $4.00, $4.201, $4.378-$4.394, $4.461,
The gains posted on Sunday night held but didn’t grow during the trade day. Prices are butting up against near term resistance — but his may also be a consolidation period to send prices higher (cold weather continues the momentum) or for the market correct to test support at $3.00 and set up the Q1 low. The answer will be in the coming seek or so as the ending inventories will provide insight as to the trader’s perspective.
Major Support:,$2.727-$2.784, $2.648, $2.39, $2.35, $2.112, Minor Support : $3.16, $3.00-$2.95, $2.914, $1.856,$1.89-$1.856 Major Resistance: $3.34, $3.39, $3.829, $3.92, $4.00, $4.201, $4.378-$4.394, $4.461,
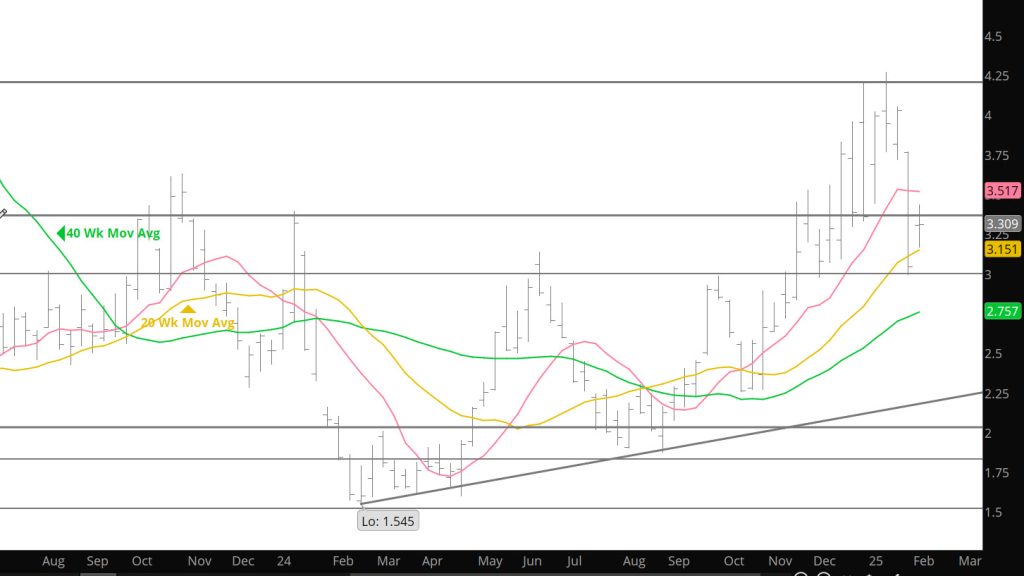
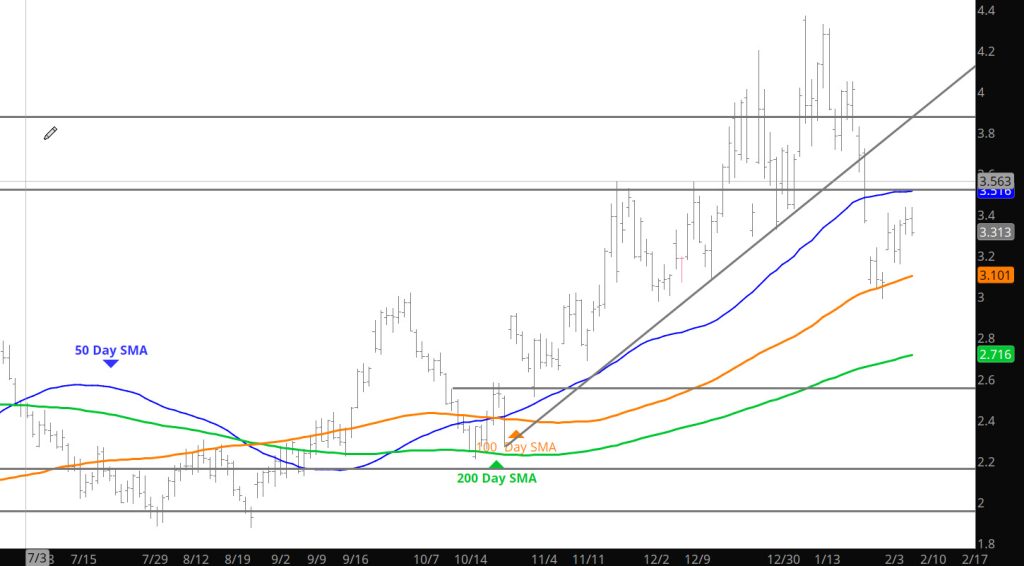
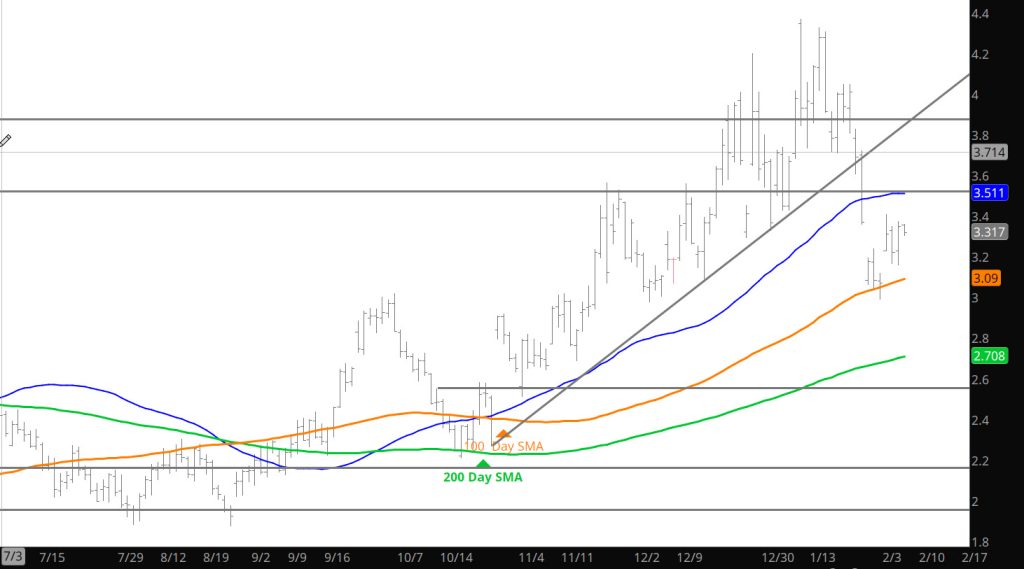
A somewhat quiet week of trade between $2.99 and just below $4. if you want to believe its the beginning of a “consolidation” period. The long – term uptrend in natural gas prices is defined by a trend line drawn from the February – March – April ’24 and the July – August lows (see above). With the caution that trend lines can be drawn with a micrometer but should be marked with chalk, the current value of the rising support is around $2.417 (Monthly chart), for calendar March the value will be $2.511 (which you might note is +/- the target mentioned above for a decline from the Q4/Q1 high that equals the 20 – years average). The lows of the last two years, which bear a striking resemblance, were constructed during February, March and April.
The intermediate term uptrend was disrupted leading into February expiration. An expanded range during which prompt gas fell from a close above $4 (01/24) to under $3 in five trading days…including a .073/dt expiration gap, led to a close for calendar January only a few cents off its low. A strikingly similar monthly bar was traded during January ’24…the total range traded a year ago was $1.355, this year $1.379. Both months inflicted substantial “technical damage” to the charts. A year ago, that damage quickly led to lower prices. March 25’s gap higher to begin February was very different but my view is that the result will be the same.
As discussed previously, March has a consistent historical tendency of trading either the high or low of its tenure as prompt by the end of its first full week. Last week I wrote to expect the expiration gap to be filled sooner rather than later and for the high of March’s tenure to be traded during the coming week . The gap was closed and March traded to a high of $2.435 before fading into the close. That recovery high, 38.2% retracement of the continuation decline from the 01/13 high and the 50 – day SMA both of which are +/- $3.500 will present substantial resistance. In the, unlikely event that March is able to trade a higher high then another test of $3 may not be in the cards, but my guess is that a violation of a rising short term trend line, will lead to that test of the December and January lows. I think that March will be offered lower.
Major Support:,$2.727-$2.784, $2.648, $2.39, $2.35, $2.112, Minor Support : $3.167, $3.00-$2.95, $2.914, $1.856,$1.89-$1.856 Major Resistance: $3.34, $3.39, $3.829, $3.92, $4.00, $4.201, $4.378-$4.394, $4.461,
Sunday trade wants to test the resistance range for prices– if you are bearish (seasonal history) then the suggestion is to look at the options. From my perspective there are likely additional declines coming so I will choose patience for now.
Major Support:,$2.727-$2.784, $2.648, $2.39, $2.35, $2.112, Minor Support : $3.167, $3.00-$2.95, $2.914, $1.856,$1.89-$1.856 Major Resistance: $3.34, $3.39, $3.829, $3.92, $4.00, $4.201, $4.378-$4.394, $4.461,
Storage release comes out today and prices have not shown an early bias (high end of the weekly range) as to expectations. Last week, folks bought in advance knowing it was likely a large with drawl– This week not so much. Last week, the gains could not be held for the day– this week we shall see.
Major Support:,$2.727-$2.784, $2.648, $2.39, $2.35, $2.112, Minor Support : $3.167, $3.00-$2.95, $2.914, $1.856,$1.89-$1.856 Major Resistance: $3.34, $3.39, $3.829, $3.92, $4.00, $4.201, $4.378-$4.394, $4.461,