Weekly Continuation
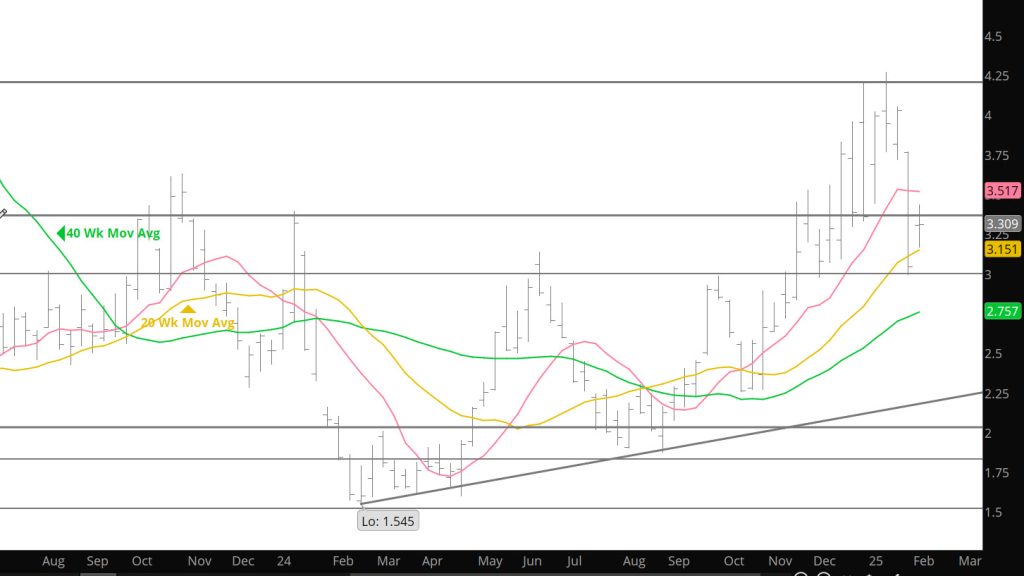
A somewhat quiet week of trade between $2.99 and just below $4. if you want to believe its the beginning of a “consolidation” period. The long – term uptrend in natural gas prices is defined by a trend line drawn from the February – March – April ’24 and the July – August lows (see above). With the caution that trend lines can be drawn with a micrometer but should be marked with chalk, the current value of the rising support is around $2.417 (Monthly chart), for calendar March the value will be $2.511 (which you might note is +/- the target mentioned above for a decline from the Q4/Q1 high that equals the 20 – years average). The lows of the last two years, which bear a striking resemblance, were constructed during February, March and April.
The intermediate term uptrend was disrupted leading into February expiration. An expanded range during which prompt gas fell from a close above $4 (01/24) to under $3 in five trading days…including a .073/dt expiration gap, led to a close for calendar January only a few cents off its low. A strikingly similar monthly bar was traded during January ’24…the total range traded a year ago was $1.355, this year $1.379. Both months inflicted substantial “technical damage” to the charts. A year ago, that damage quickly led to lower prices. March 25’s gap higher to begin February was very different but my view is that the result will be the same.
As discussed previously, March has a consistent historical tendency of trading either the high or low of its tenure as prompt by the end of its first full week. Last week I wrote to expect the expiration gap to be filled sooner rather than later and for the high of March’s tenure to be traded during the coming week . The gap was closed and March traded to a high of $2.435 before fading into the close. That recovery high, 38.2% retracement of the continuation decline from the 01/13 high and the 50 – day SMA both of which are +/- $3.500 will present substantial resistance. In the, unlikely event that March is able to trade a higher high then another test of $3 may not be in the cards, but my guess is that a violation of a rising short term trend line, will lead to that test of the December and January lows. I think that March will be offered lower.
Major Support:,$2.727-$2.784, $2.648, $2.39, $2.35, $2.112,
Minor Support : $3.167, $3.00-$2.95, $2.914, $1.856,$1.89-$1.856
Major Resistance: $3.34, $3.39, $3.829, $3.92, $4.00, $4.201, $4.378-$4.394, $4.461,