To read The Daily Call you must be a subscriber (Current members sign in here. ) Start your subscription today.
Author: Willis Bennett
See the Weekly
Daily Continuous
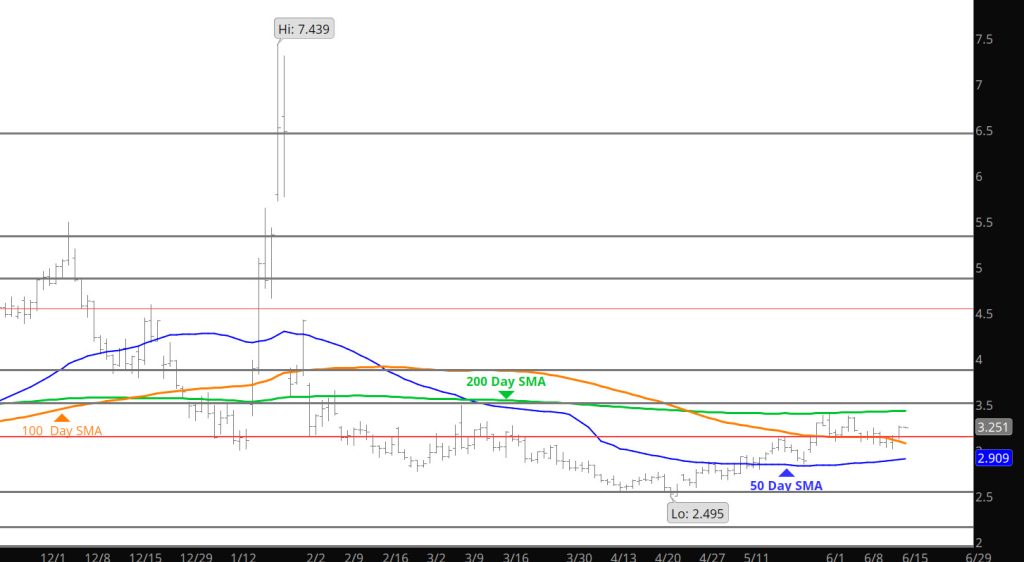
Nothing new — just play the range
Major Support: $2.640-$2.57
Minor Support/Resistance : $2.87-$2.84, $3.16-$3.148, $3.136, $3.02-$2.97
Major Resistance: $3.35, $3.486-$3.494, $3.567, $ 3.736
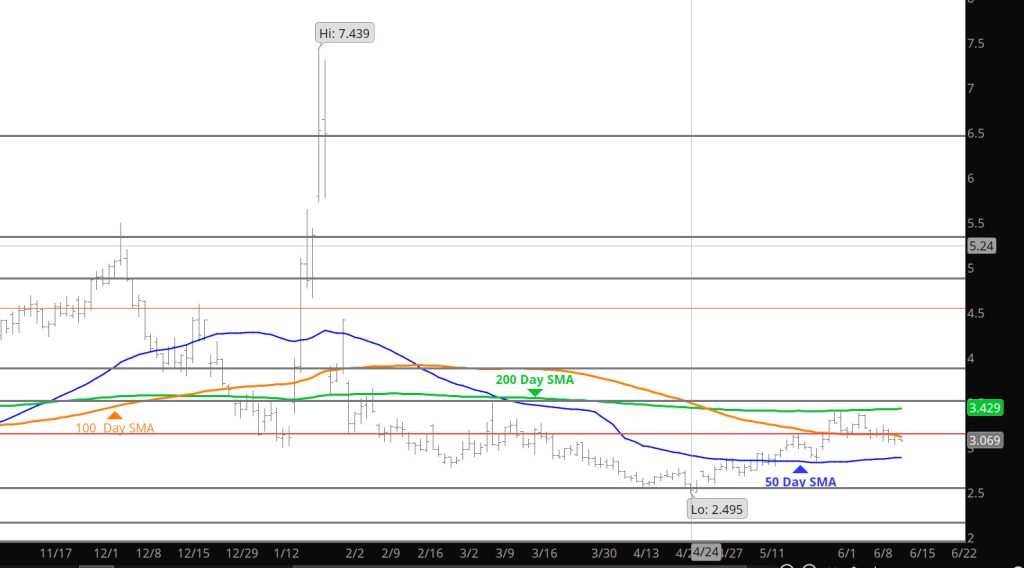
Well Look Nothing New
Daily Continuous
Still in the recent range nothing new in yesterday/s trade.
Major Support: $2.640-$2.57
Minor Support/Resistance : $2.87-$2.84, $3.16-$3.148, $3.136, $3.02-$2.97
Major Resistance: $3.35, $3.486-$3.494, $3.567, $ 3.736
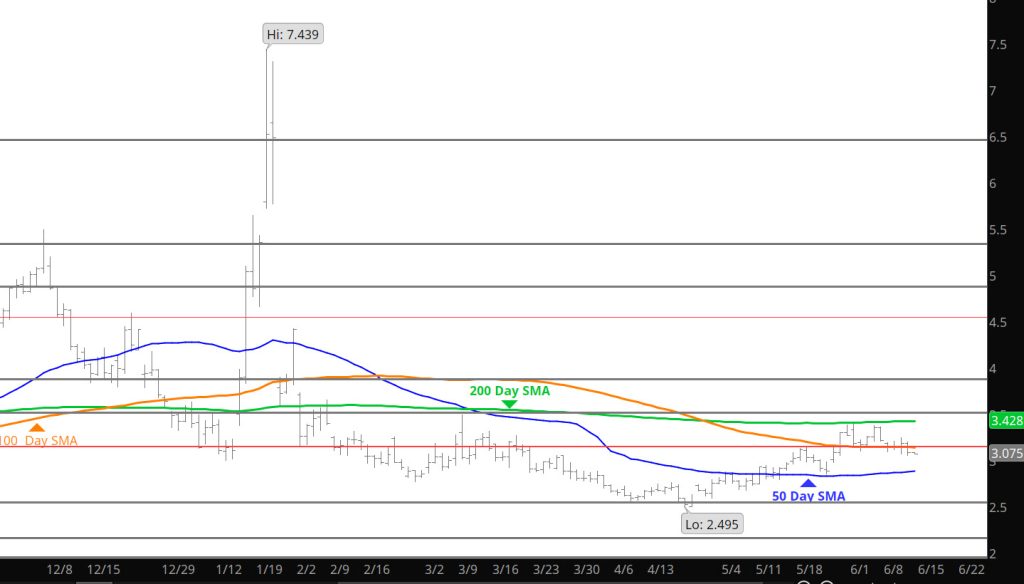
Volume Consistent
Daily Continuous
Volume has been consistent this week and last as prices have maintained the mid-range. Below last week’s average as prices fell but no impact from the range trade of the six trading days. Continue to play the range and if volatility remains dormant– selling premium is always an option (nice play on words).
Major Support: $2.640-$2.57
Minor Support/Resistance : $2.87-$2.84, $3.16-$3.148, $3.136, $3.02-$2.97
Major Resistance: $3.35, $3.486-$3.494, $3.567, $ 3.736
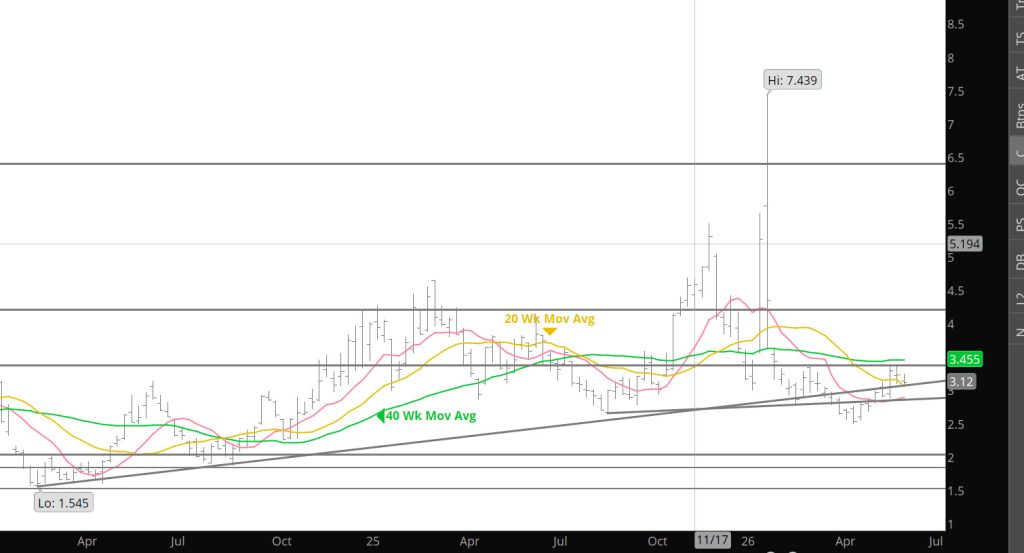
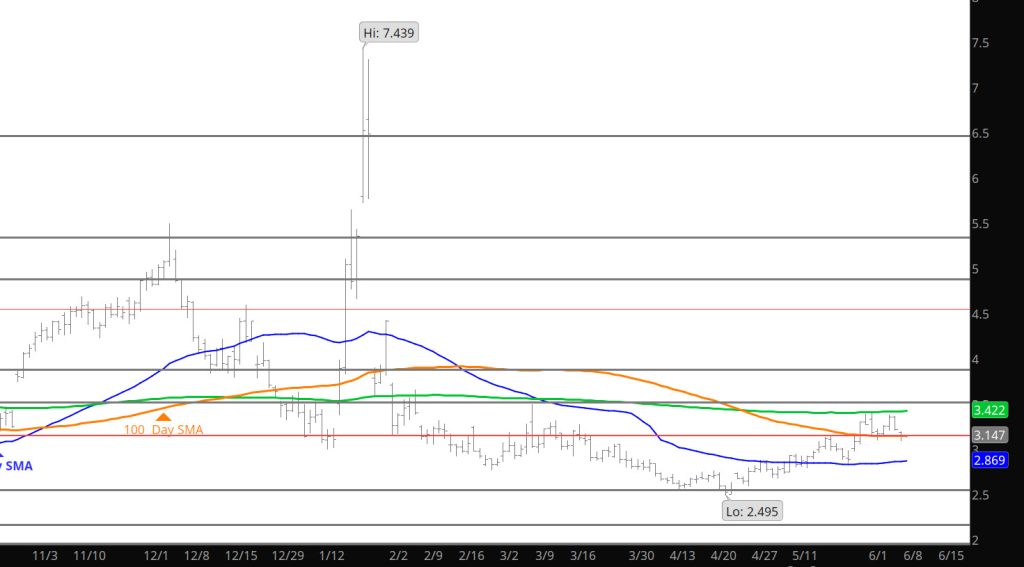
Seems Like a Test of the High End of Range
Daily Continuous
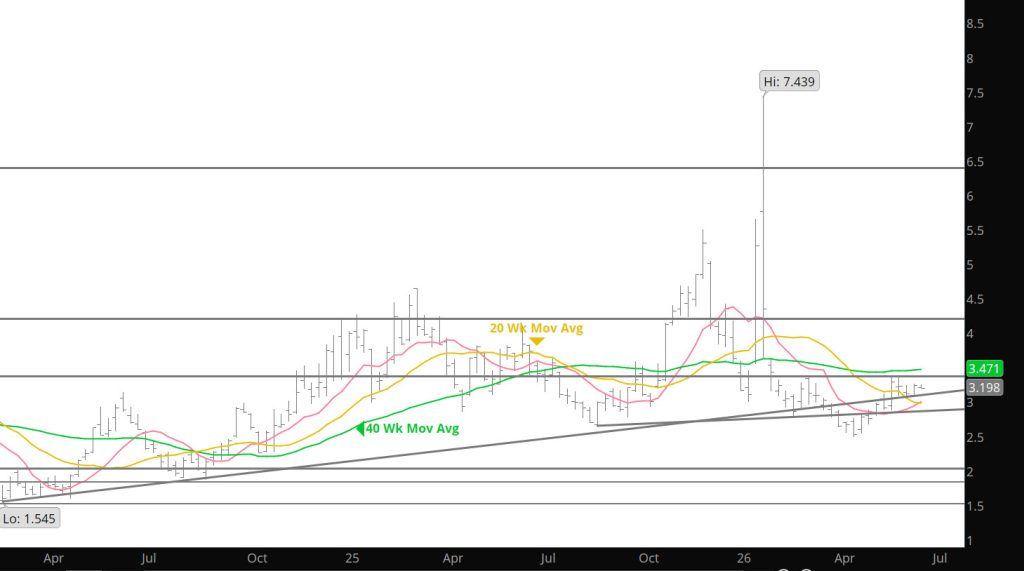
Not a whole lot to add to the title as prices rebounded and want to test the high side of the range from earlier in the month. Just before those highs is the 200 day (SMA) and / or the 40 Week (SMA) so we may get some inference at those levels.
Major Support: $2.640-$2.57
Minor Support/Resistance : $2.87-$2.84, $3.16-$3.148, $3.136, $3.02-$2.97
Major Resistance: $3.35, $3.486-$3.494, $3.567, $ 3.736
Not Much To Write
To read The Daily Call you must be a subscriber (Current members sign in here. ) Start your subscription today.
No Startling Announcement Here
Daily Continuation
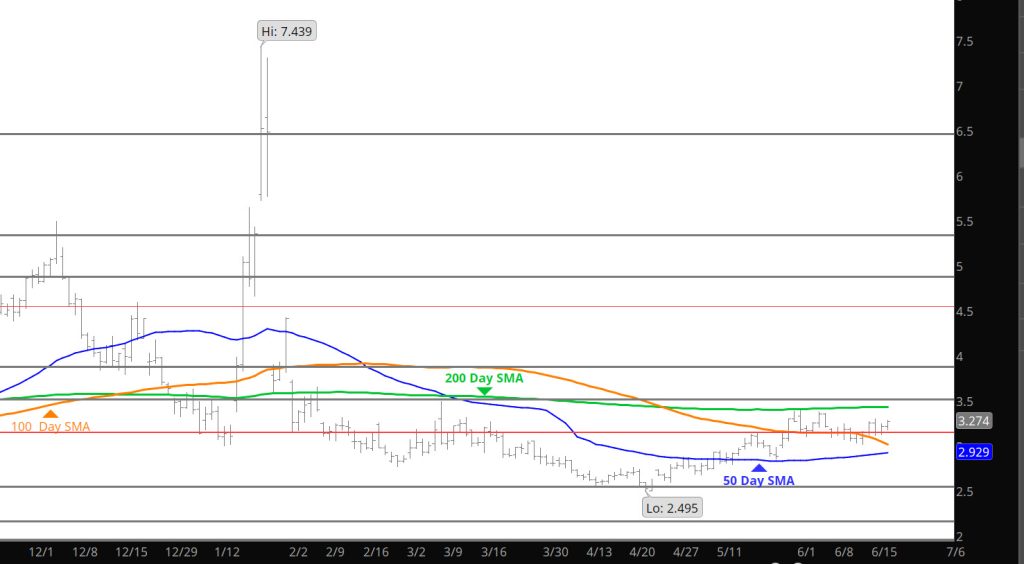
Go into what little last week provided us in the Weekly section. Really have nothing to add but it will be interesting to watch the gas markets in relation to the likelihood of volatility in the crude market. Stick with the ranges established.
Major Support: $2.640-$2.57
Minor Support/Resistance : $2.87-$2.84, $3.16-$3.148, $3.136, $3.02-$2.97
Major Resistance: $3.35, $3.486-$3.494, $3.567, $ 3.736
Storage Brings Selling
Daily Continuous
The storage release brought some selling to the price action but could not break down through support. There may be an extension to the declines today, but any further declines, testing support zones, should be met with buying at support for short term gains.
Major Support: $2.640-$2.57
Minor Support/Resistance : $2.87-$2.84, $3.16-$3.148, $3.136, $3.02-$2.97
Major Resistance: $3.35, $3.486-$3.494, $3.567, $ 3.736
Interesting Time
Daily Continuous
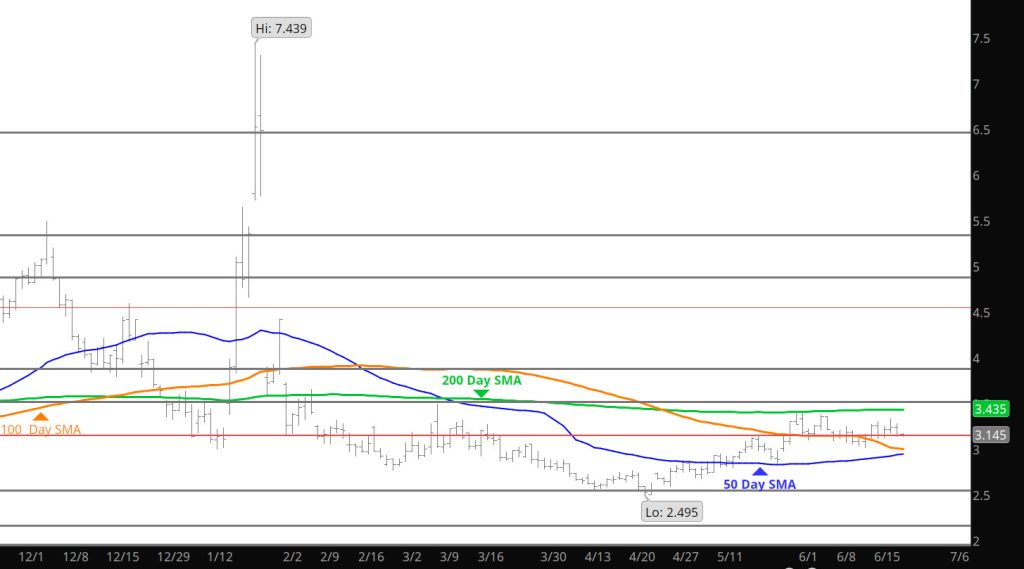
So now we sit at the initial low end of the range– I am expecting a push down to the $3.00-$3.10 area before we get a strong inclination of the potential break down– out of this range.
Major Support: $2.640-$2.57
Minor Support/Resistance : $2.87-$2.84, $3.16-$3.148, $3.136, $3.02-$2.97
Major Resistance: $3.35, $3.486-$3.494, $3.567, $ 3.736
Range is the Name of the Game
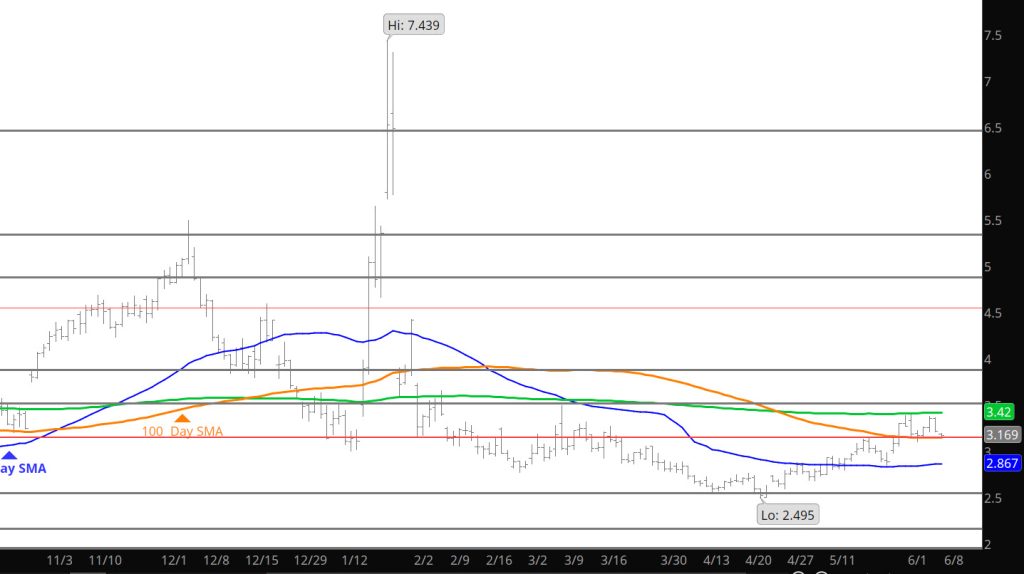
Daily Continuous
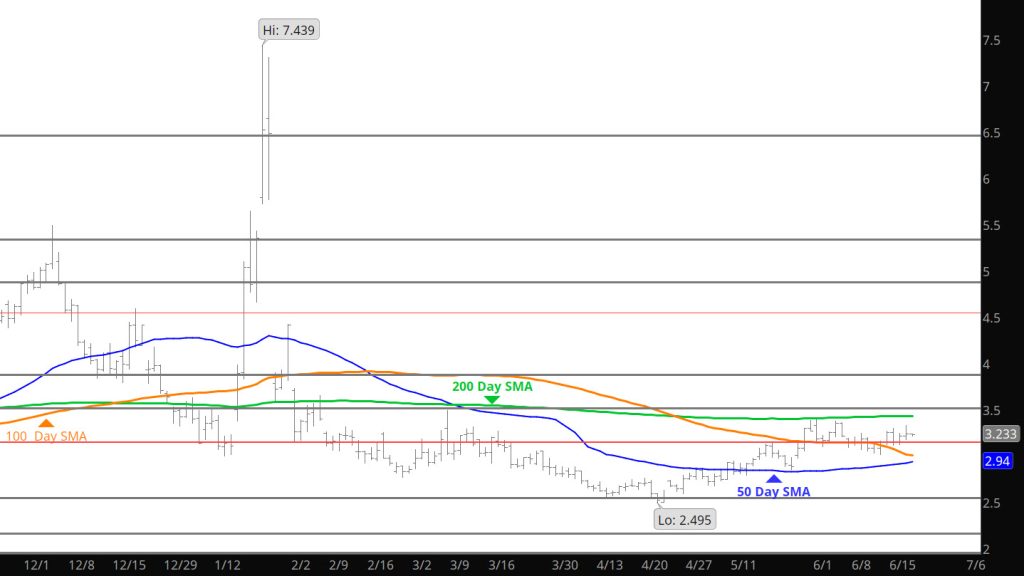
As the chart above indicates, the market has stayed in a tight range for the last eight trading sessions and that include the expiration of the June contract. if you expand support the range goes out to last March. Not sure what will breakout or down from this range — but for now it seems like a good trading environment.
Major Support: $2.640-$2.57
Minor Support/Resistance : $2.87-$2.84, $3.16-$3.148, $3.136, $3.02-$2.97
Major Resistance: $3.35, $3.486-$3.494, $3.567, $ 3.736