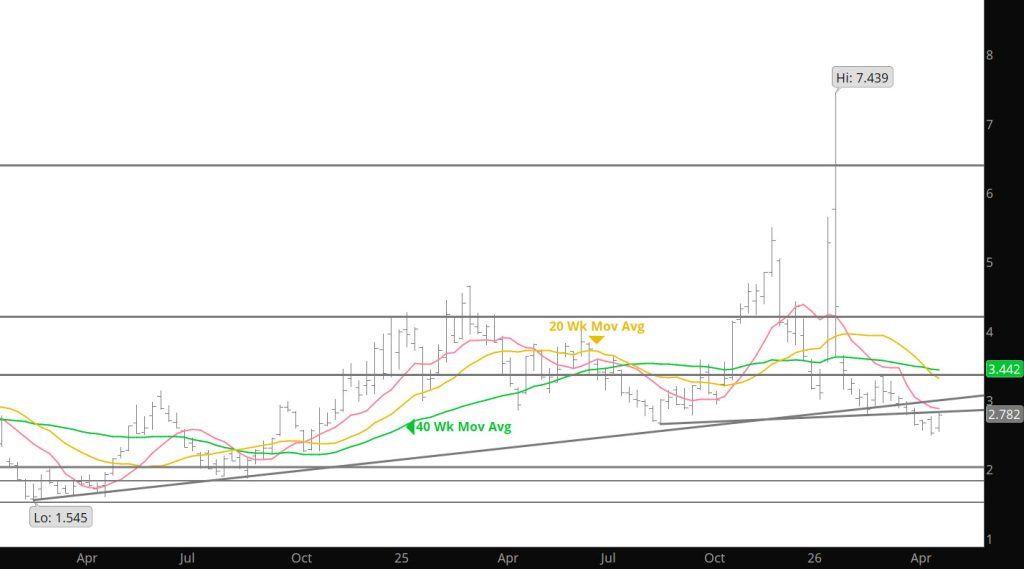
Weekly Continuous
During calendar April the May contract closely followed the tendency to weaken into the period immediately before settlement. May ‘26’s lower low on the last day of its tenure before a modest recovery most closely resembles 2024. May ’24 traded to $1.482 (which in that case happened to be a perfect test of the March Q1 low at $1.481) before going off the board at $1.614.
Similar to this year volume was drying up…suggesting that prompt gas was constructing a significant low, but there was a notable difference in the premium afforded to the new prompt. June ’24 opened its first day as prompt at $1.923, leaving an “expiration” gap between $1.628 and $1.916. This year the gap is $2.578 – $2.592. That difference likely says something about fundamental expectations but I have no clue.
A purely technical view of the spring of ‘24 is that June’s premium enabled it to close above the March high on its first day as prompt, this then became support. This year prompt June is looking up at, and Friday began to test resistance presented by the March ‘26 low ($2.803 v June’s post expiration high of $2.821 and close of $2.780).
The takeaway may be that the gas market traded a traditional spring low coincident with May expiration as it has in a number of other years …expect something similar to those other years during spring and early summer ’26.
With the assistance of June’s premium, prompt gas traded an “outside” week reversal higher and ended the week above last week’s high. Reversals from lower lows have long been the gas market’s preferred method of communicating that an unsustainable low had been traded…the fly in that ointment is that the volume to confirm that reversal was miss.
Given the expectation of seasonal strength but the lack of volume prompt June will likely discover sponsorship well above the May expiration low while trading sideways to a little higher for most of its tenure as prompt.
A week ago, the consensus of technical indicators improved back to neutral (where it had been for seven weeks) after one week in negative agreement for the first time since the decline to the Q3 ’25 low. This week the consensus continued to improve.
Last week the primary momentum indicators, the weekly calculations of the MACD and RSI were in negative agreement. This week there is no agreement. The “lagging” MACD is negative for a thirteenth week. The “leading” RSI improved to positive without ever reaching its extreme zone. Daily calculations ended positive…the RSI after closing with an extremely oversold reading, the MACD turned higher with the potential bullish momentum divergence mentioned in the last couple of weeks.
Market internals, have gradually improved over the last two weeks were mixed. Volume fell a little week over week, but that decline can be attributed to only 252,472 contracts changing hands as May traded to a lower low before going off the board. Even with that, average daily volume of +/- 356,500 contracts was only about 4,500 lower.
Major Support: $2.640-$2.57
Minor Support/Resistance : $2.87-$2.84, $3.16-$3.148, $3.136, $3.02-$2.97
Major Resistance: $3.35, $3.486-$3.494, $3.567, $ 3.736