To read The Daily Call you must be a subscriber (Current members sign in here. ) Start your subscription today.
Author: Willis Bennett
Mini-Range Developing?
To read The Daily Call you must be a subscriber (Current members sign in here. ) Start your subscription today.
How Far Does Decline Go
To read The Daily Call you must be a subscriber (Current members sign in here. ) Start your subscription today.
Storage Release Breaks Old Support
To read The Daily Call you must be a subscriber (Current members sign in here. ) Start your subscription today.
What More Can Be Said
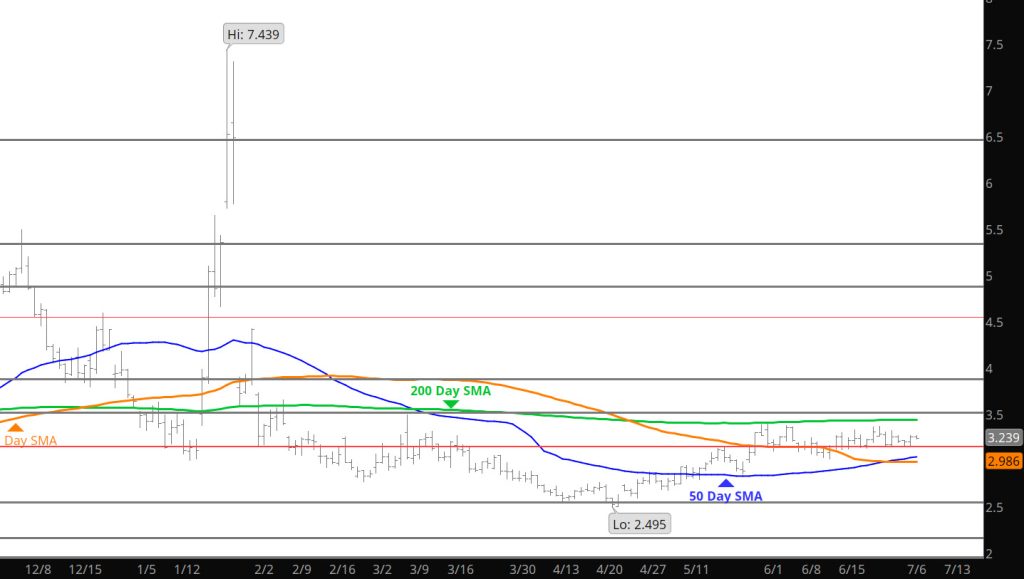
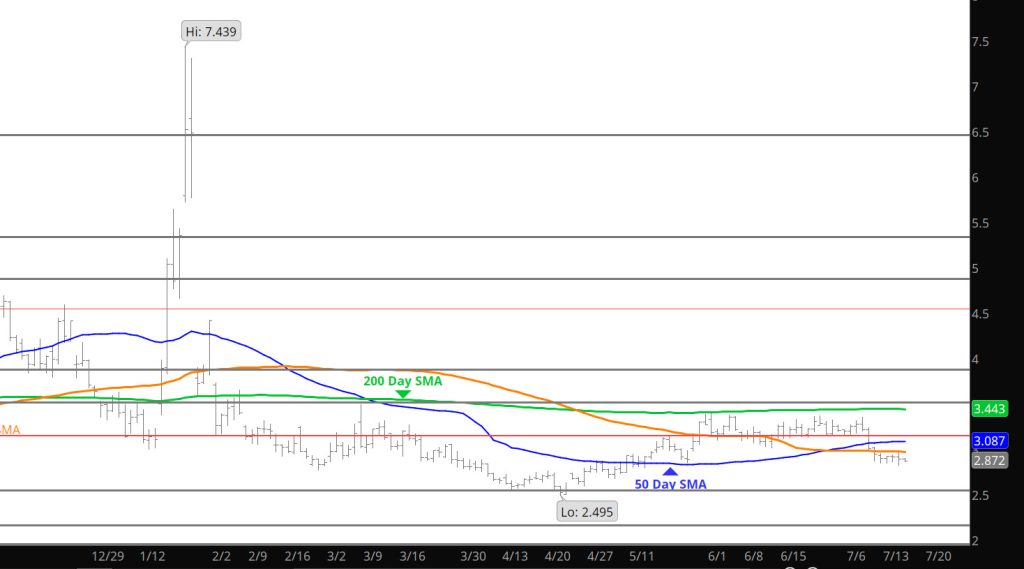
Daily Continuous
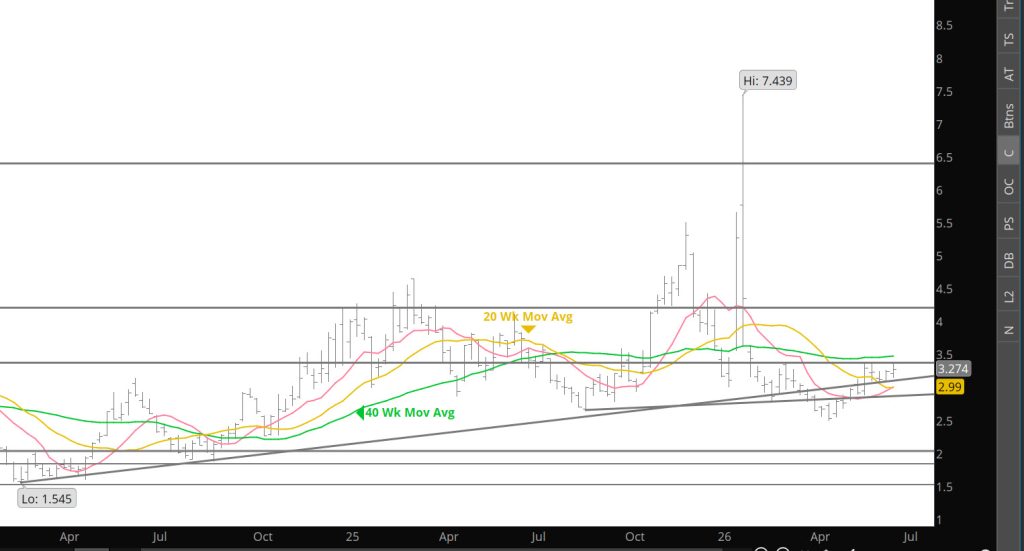
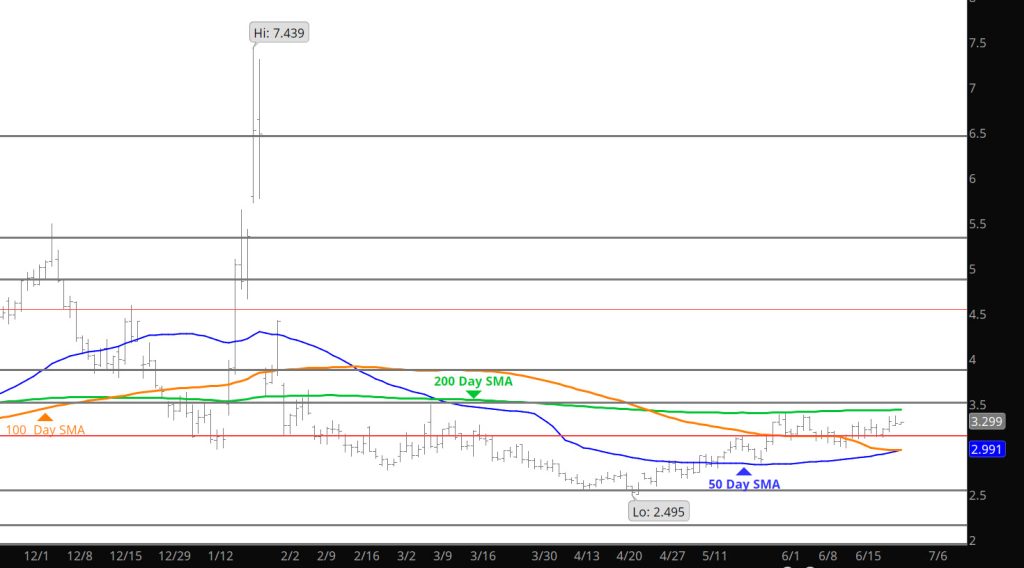
Boring range trade world– due to this range trade and amount — when this market decides to break out or down it will with a vengeance.
Major Support: $2.640-$2.57
Minor Support/Resistance : $2.87-$2.84, $3.16-$3.148, $3.136, $3.02-$2.97
Major Resistance: $3.35, $3.486-$3.494, $3.567, $ 3.736
Range Trade Supports a Break Eventually
To read The Daily Call you must be a subscriber (Current members sign in here. ) Start your subscription today.
Eventually This Market Will Break
To read The Daily Call you must be a subscriber (Current members sign in here. ) Start your subscription today.
Was Looking For History
To read The Daily Call you must be a subscriber (Current members sign in here. ) Start your subscription today.
New Prompt — Same Range — So Far
To read The Daily Call you must be a subscriber (Current members sign in here. ) Start your subscription today.
Holiday Has History
To read The Daily Call you must be a subscriber (Current members sign in here. ) Start your subscription today.