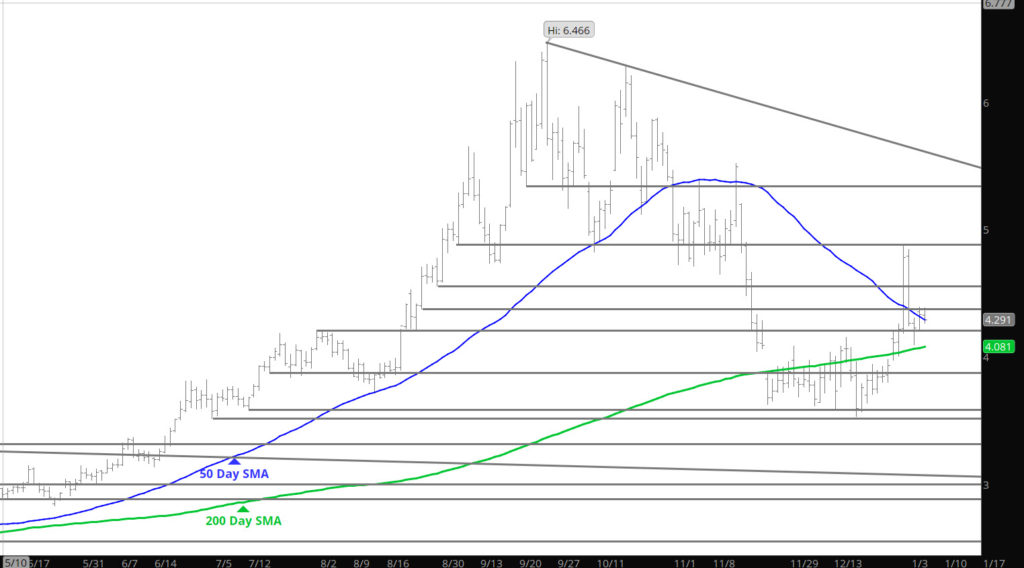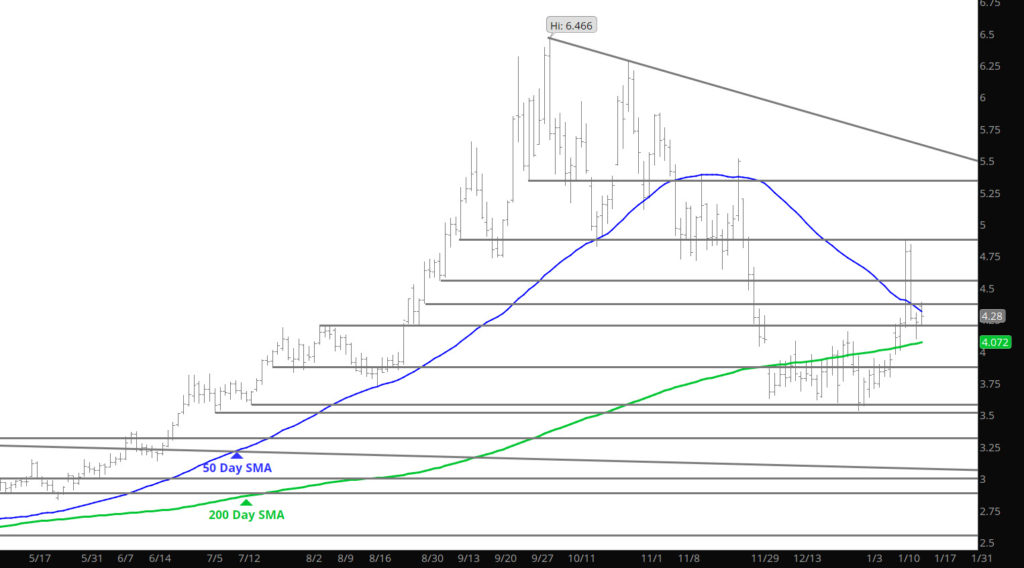
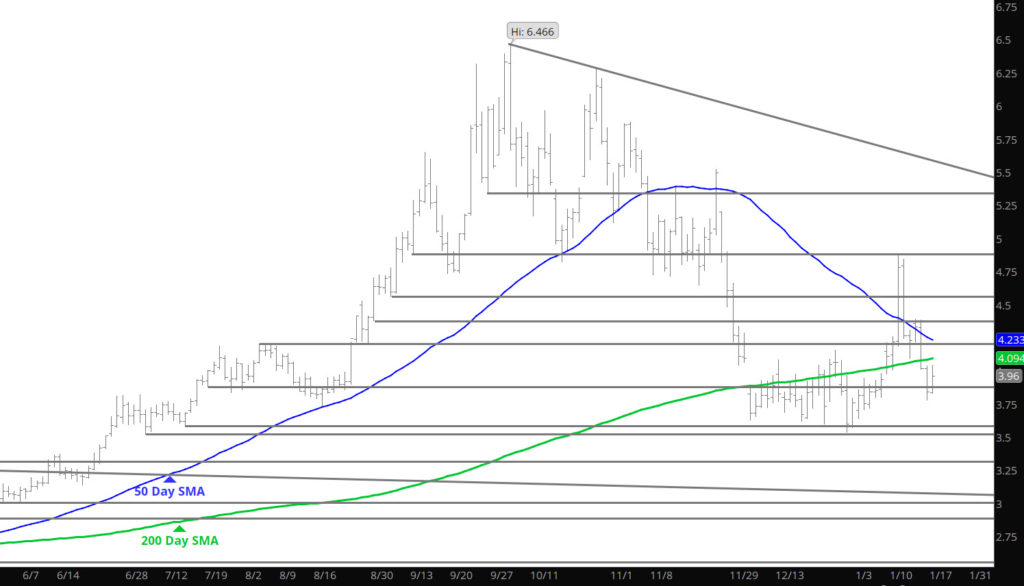
Cannot add anything to what has been said in the Daily and the Weekly– Options expiration is upon us–$4.00 will be important.
Major Support: $3.734, $3.63, $3.584-$3.522 63, $3.584-$3.522
Minor Support: $3.82
Major Resistance: $4.02, $4.18, $4.32
![]()
Cannot add anything to what has been said in the Daily and the Weekly– Options expiration is upon us–$4.00 will be important.
Major Support: $3.734, $3.63, $3.584-$3.522 63, $3.584-$3.522
Minor Support: $3.82
Major Resistance: $4.02, $4.18, $4.32
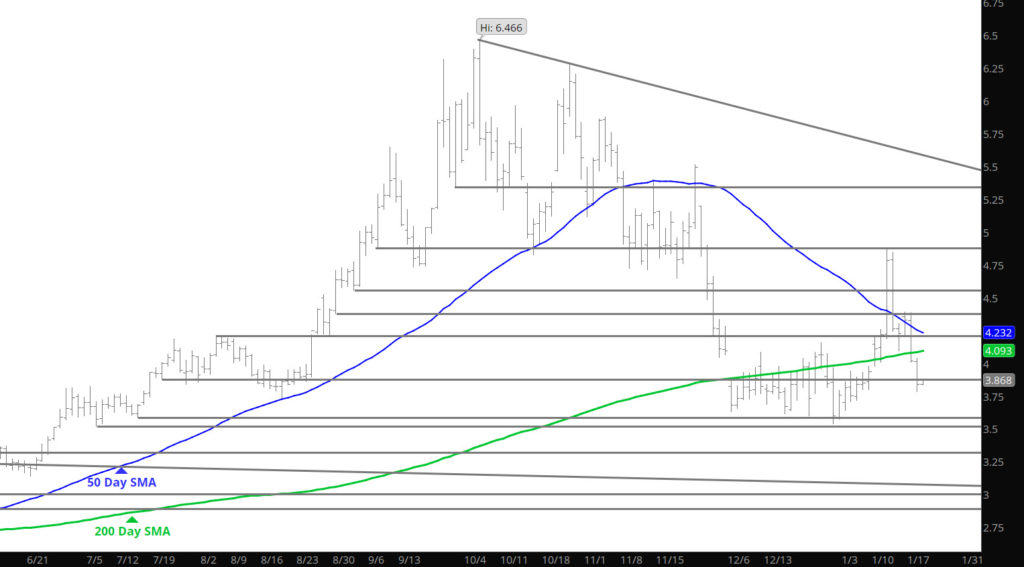
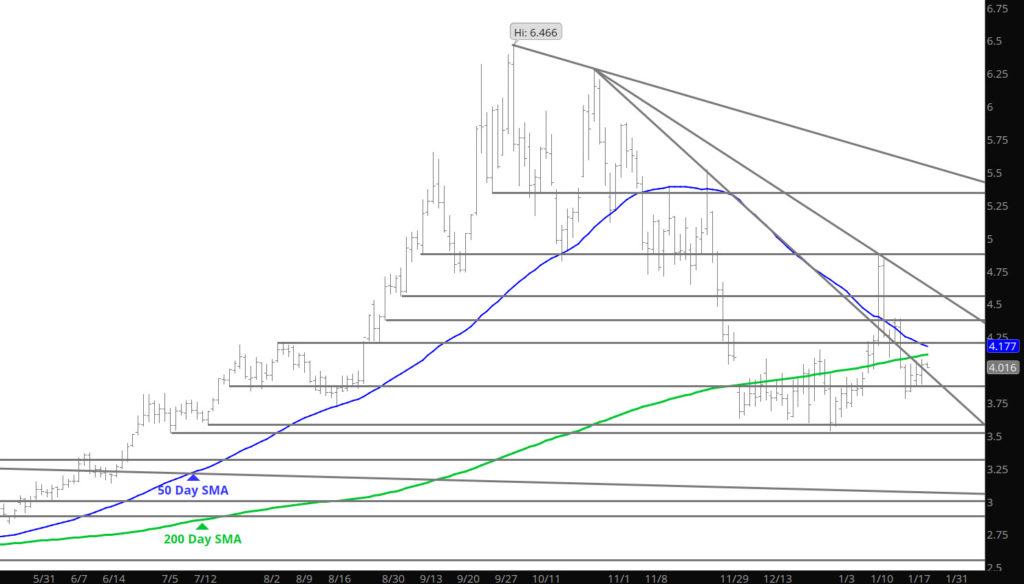
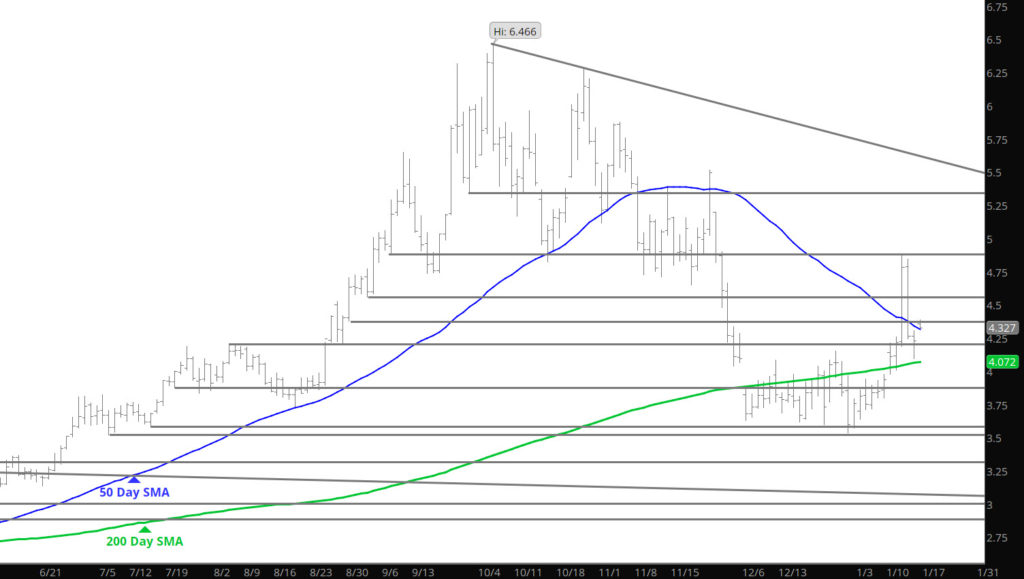
Not a whole bunch of directional information from yesterday’s trade, rather than the fact that prices rallied only to find sellers. Summer prices lagged the gains and losses but not by a significant amount. Have discussed the recent 10 month trend of expiration’s in the Weekly section and now the market enters the last three days of trade. Perhaps weakness continues for a day or so, but you can’t bet against the trend until it breaks.
Major Support: $3.734, $3.63, $3.584-$3.522 63, $3.584-$3.522
Minor Support: $3.82
Major Resistance: $4.02, $4.18, $4.32, $4.48, $4.73-$4.775, $4.818-$4.825, $5.045
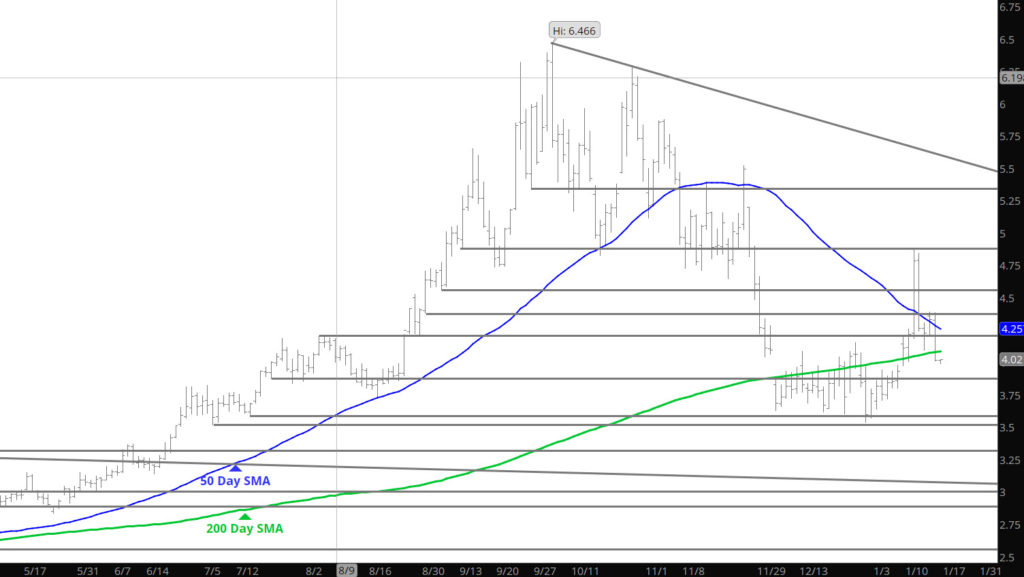
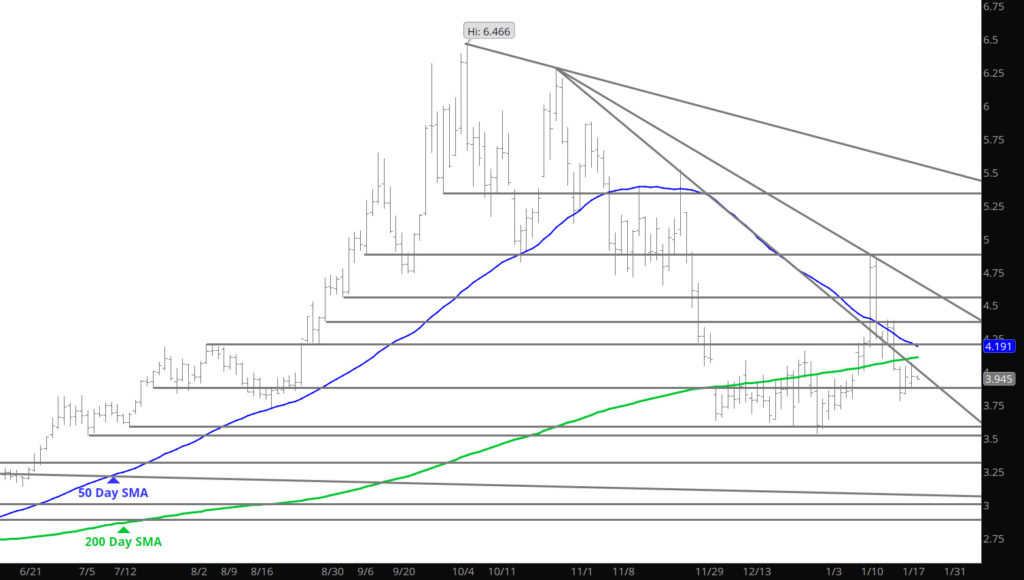
Price action rebounded off of the lows from the storage report declines, bouncing off of weak support areas and found support as the day went on. This type of bounce is likely related to some changes in the forecasts and if your desire is to trade these chops then feel free. My concept is to show patience — wait for a strong test of support between $3.70 and last week’s low $3.78 to add to positions. Go into the expiration history in the Weekly section and strongly recommend reading it.
Major Support: $3.734, $3.63, $3.584-$3.522 63, $3.584-$3.522
Minor Support: $3.82
Major Resistance: $4.02, $4.18, $4.32, $4.48, $4.73-$4.775, $4.818-$4.825, $5.045
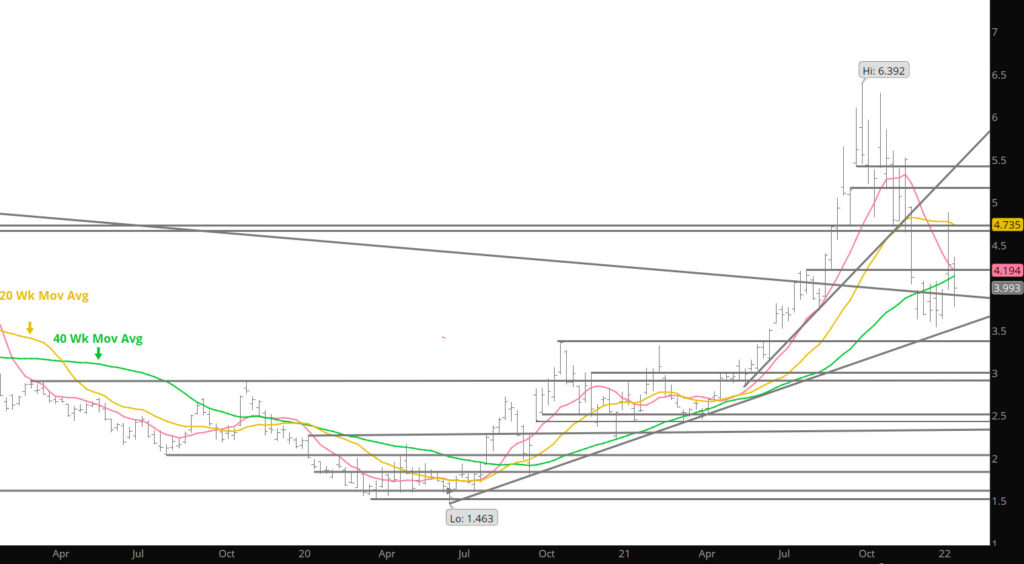
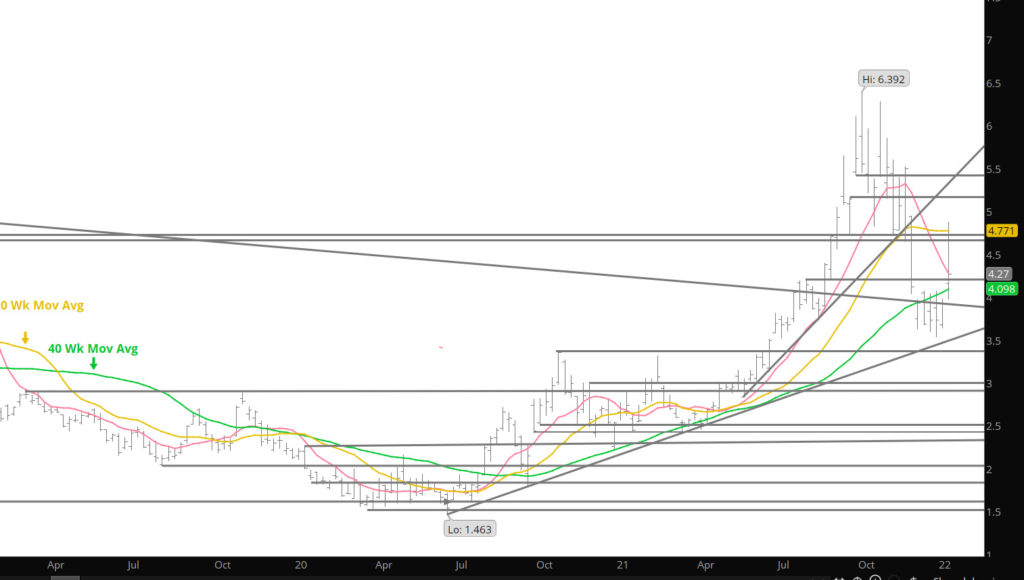
Discussed in the Weekly section, the tremendous decline in open interest since September had brought with it a potential upside vulnerability. Discussed it last week as more of a fact not a question of if. This last week, prices all along the maturity curve moved dramatically higher with both volume and open interest increasing substantially (average daily volume by an estimated 200,000 contracts and open interest by the most contracts since the week beginning June 28th) . I mentioned in Weekly section that February would remain range bound, while still expecting a range bound trade, clearly the levels of the range has changed to higher levels. Last weeks action also strongly suggests a significant intermediate term low may be in place. Expect price weakness to attract substantial interest at progressively higher levels.