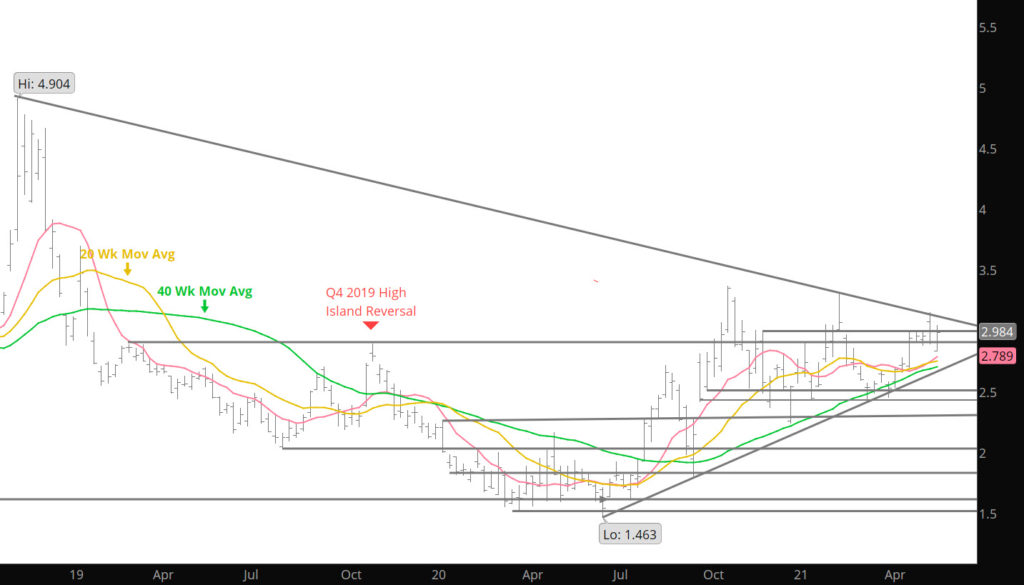
June opened the week with a gap lower on Sunday night only to reverse and close the gap — settling at the higher end of the range it had traded most of the month. Once June was off the board, July, which had followed June’s directional movements, gave up the expiration related gain, retreating to retest its gap lower opening. July had begun trading at 2.920, traded to 2.903 and then rallied to 3.046. Thursday’s low at 2.914 along with June’s pre – expiration low daily close (2.886) likely redefines the key support zone. The new prompt recovered again from that support in typical low volume pre – holiday trade to end calendar May at 2.986 after ending April at 2.978 (developing a theme here). All of the Q2 months have traded down to lower levels, but all were also well – bid into expiration. You may recall that last year those Q2 months were far from well-bid after trading earlier lows.
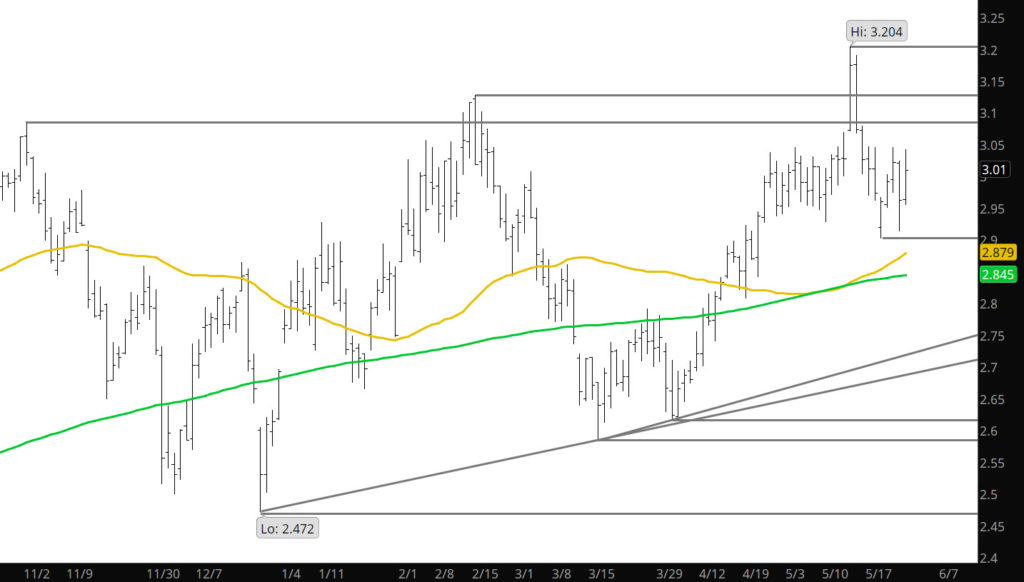
Spot July Contract
The interesting chart is the Spot July contract which shows a higher low after each rally since the low of July last July. Different from the Continuous chart above, the highs in July have continued to be higher than the previous high which is variant to the Continuous price action. While the highs attained last month ($3.15) fulfill the rally of Q2 over Q1 lows (average rally) I am not convinced that that will turn out to be the final Q2 high. The prompt chart suggests that July has not finished its run.