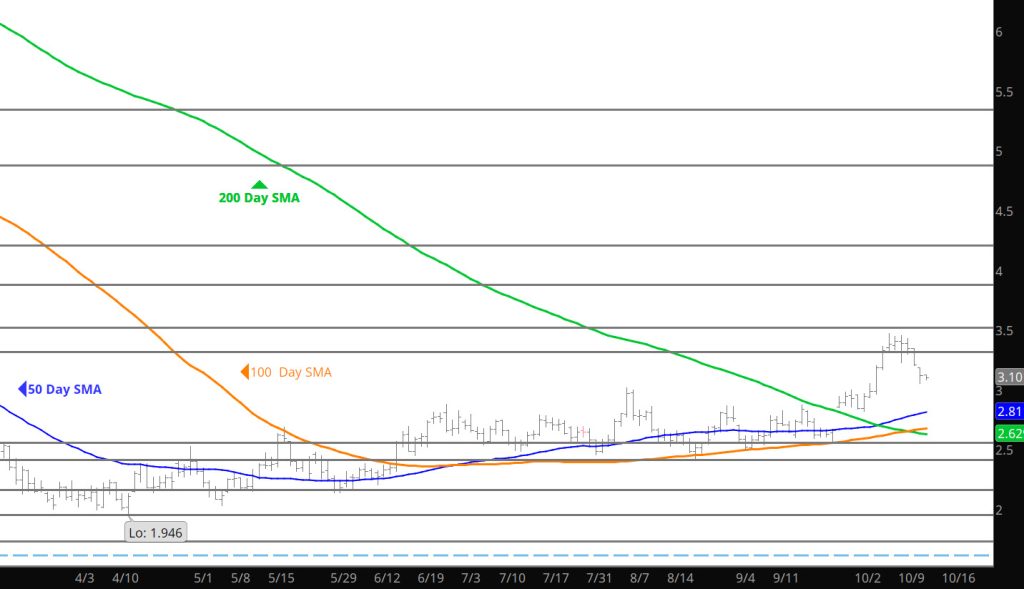
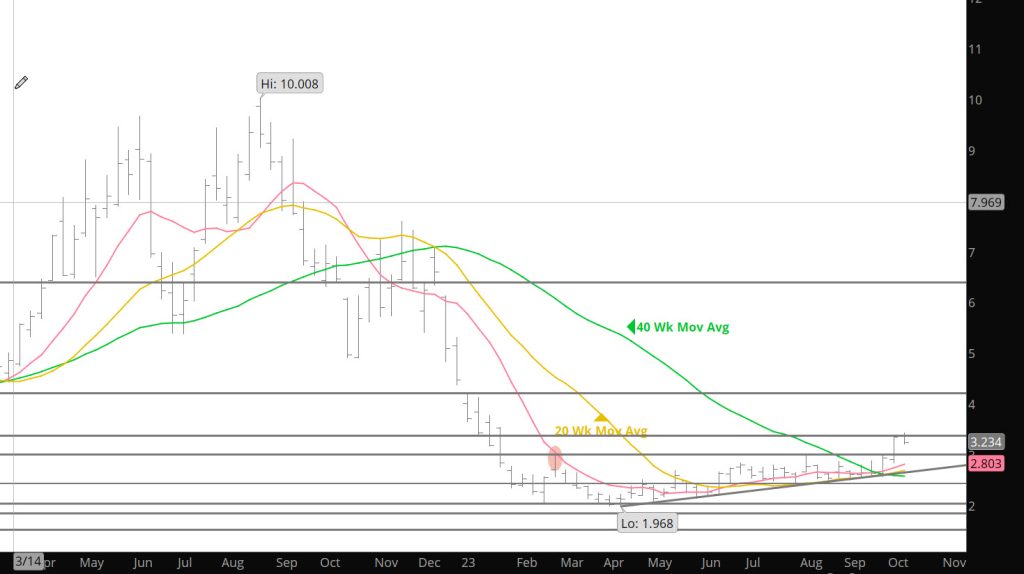
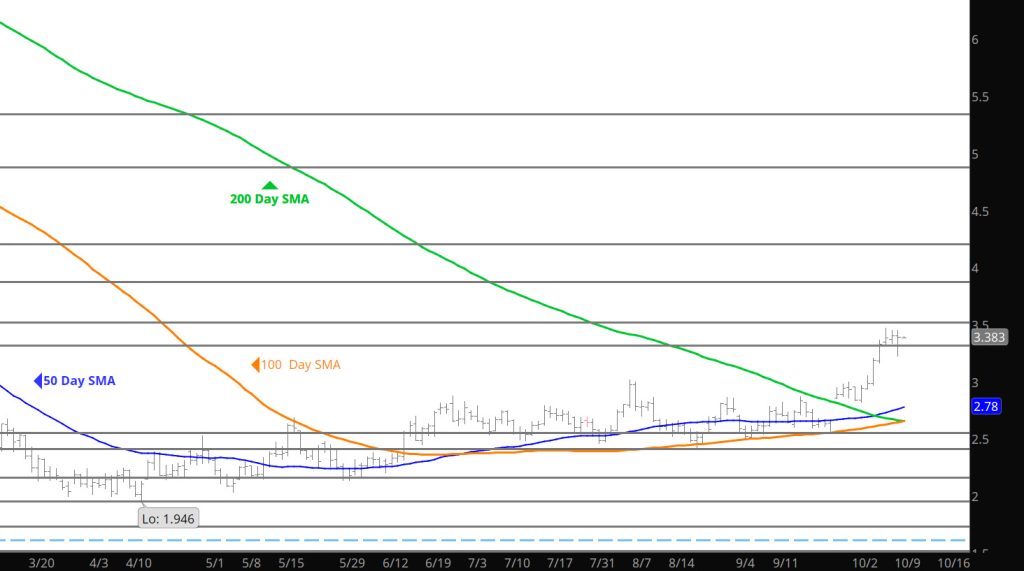
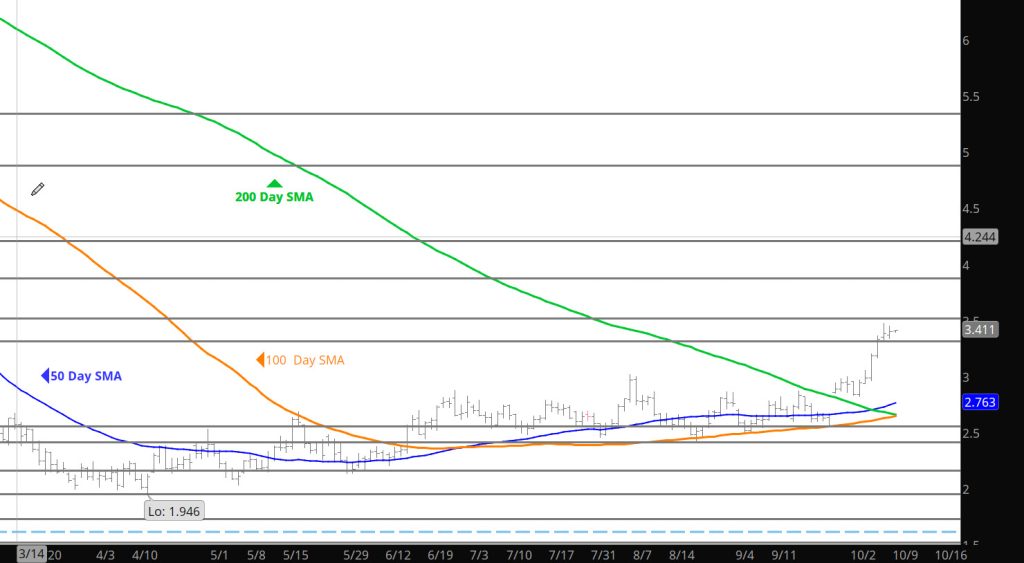
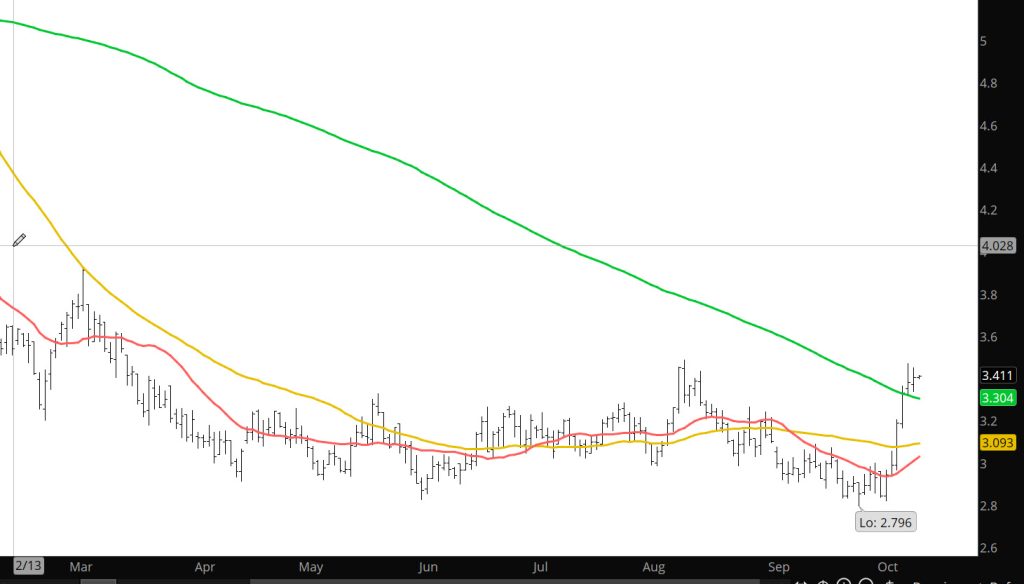
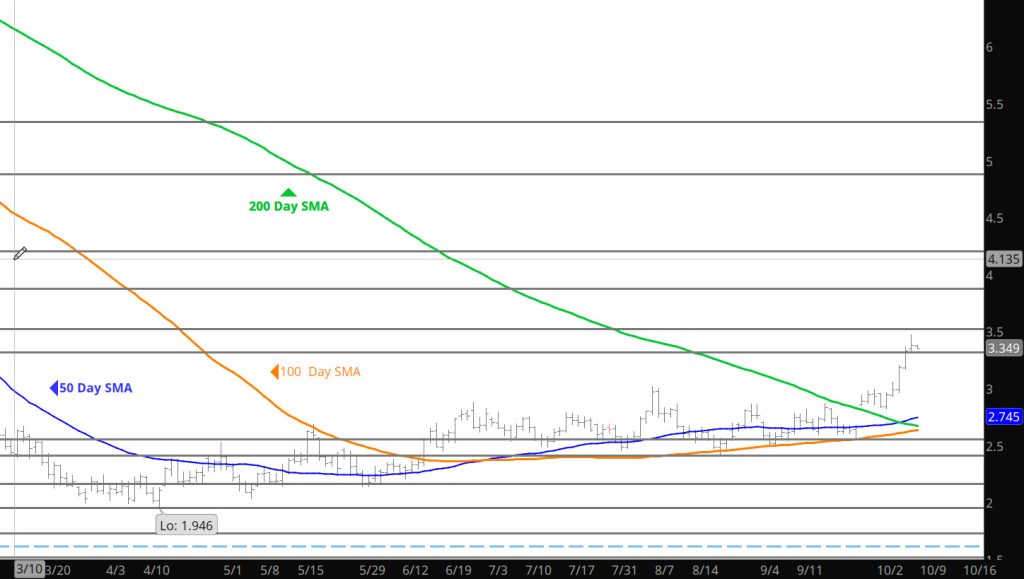
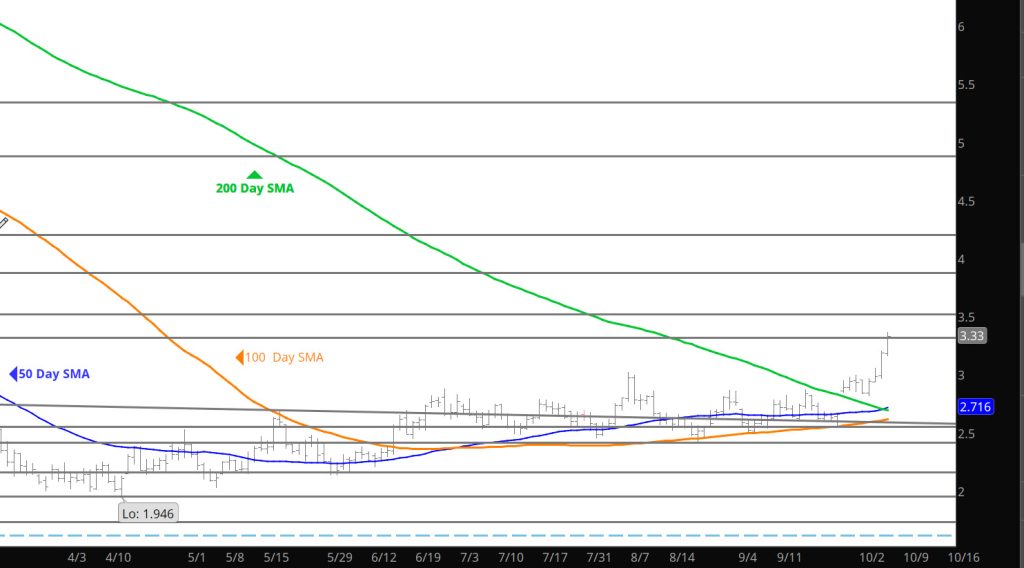
A little surprised that the break out to the highs from Feb occurred this early in the September prompt (was expecting it after Labor Day) but perhaps that timing will provide the next leg in the current run. Nevertheless, yesterday provided the proof of what has been suggested here for a couple of months – that a series of higher highs and higher lows, is signalling the gradual demise of the bear market in 2023. What is next — storage report will be interesting to watch what occurs after the gains of yesterday — but my expectation is a retracement of the gains during the trade and a test of support provided by the old range.
Major Support: $2.47, $2.00, $1.991-$1.96, $1.795-$1.766 Minor Support $2.836-$2.81, $2.38-$2.26, $2.17 Major Resistance $3.00, $3.536, 3.59
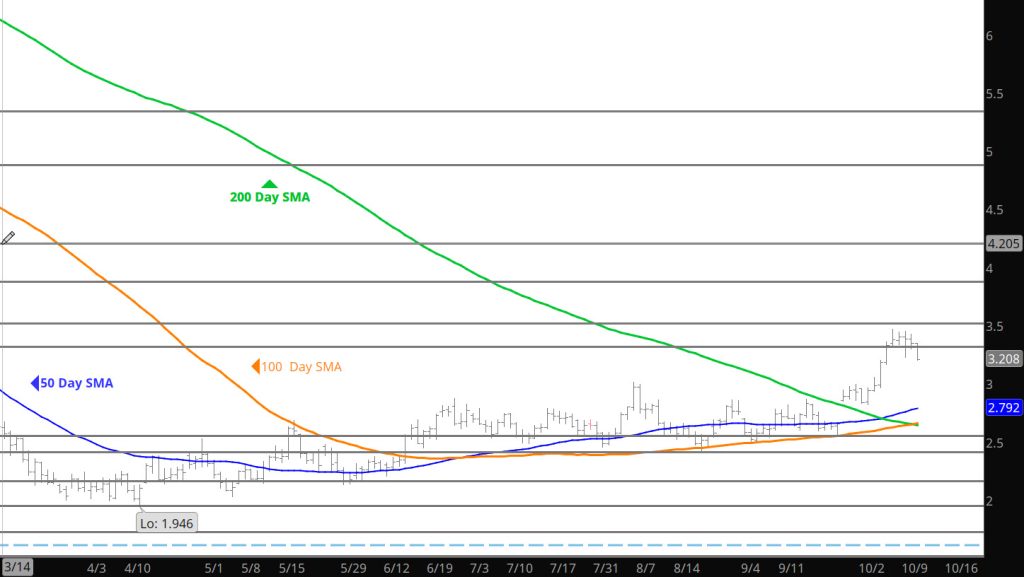
Last week the market tested the low end of the range and closed the day just off the lows– this week prices are testing the high end of the range and close yesterday just off the highs. Explained last week that the price action was great for the traders and it continues to be. My only concern is when does the high end break out or when does the low end break down. For now .. it is the potential break out to higher prices.
Major Support: $2.00, $1.991-$1.96, $1.795-$1.766 Minor Support:$2.52-$2.47, $2.38-$2.26, $2.17 Major Resistance $2.816-$2.836, $3.00, $3.536, 3.59
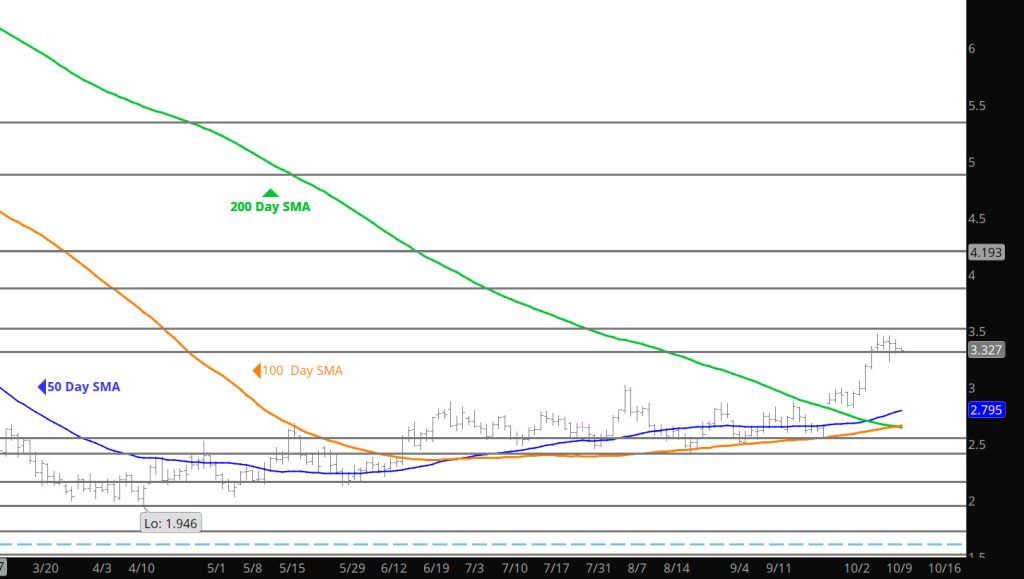
It didn’t take long for the market to rebound and run a little off of last week’s test of support and start to challenge the the near term resistance. Did not expect the run as quick nor as decisive as it was– but here we are. Find it interesting that some of the pundits have started to adjust commentary to more bullish aspects of the market (heat continuing, Russia cutting gas to Europe and storage still at a surplus to averages — now later has become a concern) but if my suspicions are accurate — you will see a test of last months highs coming.
Major Support: $2.00, $1.991-$1.96, $1.795-$1.766 Minor Support:$2.52-$2.47, $2.38-$2.26, $2.17 Major Resistance $2.754, 2.816-$2.836, $3.00, $3.536, 3.59
Last Week’s low broke slightly lower than expiration week, as September did trade a lower low ($2.457 vs $2.463 previous week. That extends the seasonal Q3 decline to 13.5% from the June Q2 high ( less than half of the ten year average for the decline) and goes into the books as a violation of the July low for the fourth straight year. The absence of any follow through after trading a lower low says something about the support that we have talked about for the last several weeks. Prompt gas hasn’t traded an “outside” August (trade through both the July low and high) since 2010 but back then it use to do it on a regular basis (’10, ’09, ’07, ’02 and ’01). Given the “recent” history trading through $2.793 (the July high) seems like a low probability event.
For the fourth straight week support above $2.450 limited any further decline. The last lower low was $2.448 on June 21st. The prompt did start out a little stronger (trading to a high of 2.693) after settling the previous week at $2.638 but quickly failed. For eight straight trading days prompt gas failed within the range of the last high volume day (July 20th) when a few more than 500,000 contracts traded. The high that day was $2.789. Trading highs within the range of a high volume day is characteristic of the continuing consolidation and construction of a trading range. The zone between the July high and the June high, $2.839, forms the upper boundary the recent range.
Prices stayed in the near term range (discussed in the Weekly Section) last week and I will expect the continuation of this pattern for the near term. Know it is boring and not a lot of revenue potential but it can provide good opportunities selling premium in the options market.
Major Support: $2.00, $1.991-$1.96, $1.795-$1.766 Minor Support:$2.52-$2.47, $2.38-$2.26, $2.17 Major Resistance $2.754, 2.816-$2.836, $3.00, $3.536, 3.59
If you are a trader you have to love this action. Prices decline to test the support level then immediately rebound. My question is where does this rally take prices to– stick with the range and the mini-range from last week for the resistance area just beyond $2.70.
Major Support: $2.00, $1.991-$1.96, $1.795-$1.766 Minor Support:$2.52-$2.47, $2.38-$2.26, $2.17 Major Resistance $2.754, 2.816-$2.836, $3.00, $3.536, 3.59
Just when I made the comment about the boring aspects of the market it decides to break lower and test the support zone from the middle of June that has held the market since ($2.47). Now what happens — do the bears force declines to the $2.20area or does it find buyers for a short term bounce.
Major Support: $2.00, $1.991-$1.96, $1.795-$1.766 Minor Support:$2.52-$2.47, $2.38-$2.26, $2.17 Major Resistance $2.816-$2.836, $3.00, $3.536, 3.59
Not much to see and little to do as prices remained dormant for the upcoming fall. Not enough volatility to make selling premium a strong option and no directional bias sounds like a recipe to go fishing. This may turn out to be the way the September contract plays out with no strong bias and just in a range. We shall see.
Major Support: $2.00, $1.991-$1.96, $1.795-$1.766 Minor Support:$2.52-$2.47, $2.38-$2.26, $2.17 Major Resistance $2.816-$2.836, $3.00, $3.536, 3.59
After trading another weekly high, failing at the band of resistance discussed last week, there have now been four straight weekly highs between $2.750 and $2.793, six between $2.740 and $2.839. There is clearly technical resistance in this zone and seldom as clearly defined as that. August went from premium to September in a hurry as it quickly made its way to support, also is just about as clearly defined. The lows of the last three weeks have been $2.492, $2.484 and $2.463. August went off the board exactly equal to the low two weeks ago and a little above the others ($2.492, $.111 under July and the first lower contract expiration since April settled at $1.991). discussed previously, the August contract has been described as historically amply offered. Given the way it went to expiration that again appeared to be the case. The low of its tenure as prompt printed shortly before trading in the contract ceased. Absent a high volume breakout through the resistance described above, September is likely to be subject to the same price negative Q3 seasonal pressures as its predecessor.
Long time readers know that I utilize and trust historical trends and almost always write about seasonal pressures during the summer. The weak close of August gas notwithstanding there really hasn’t been a lot of evidence of that seasonal pressure during the summer of ’23. From the 06/28 Q2 high to Thursday’s expiration July low prompt gas fell $.376 or 13% vs a ten year average decline of 27%. There is a long time left in the calendar quarter, but the historical fact is that September gas tends to trade the low for its tenure as prompt in early August. Over the last seven years (since 2016) that low has traded between the first and sixth trading days of the month five times (’17, ’18, ’19, ’20 and ’22), on the tenth trading day once (’16) and on the fourteenth once (’21). September contracts have settled from $.073 (’18) to $.725 (’20) higher than August in all but one of those years (-$ .008 in ’17). The takeaway from that is that while it has not always been so, in recent years seasonal pressure has been more likely to be in evidence in July and September.